Fig. 6.
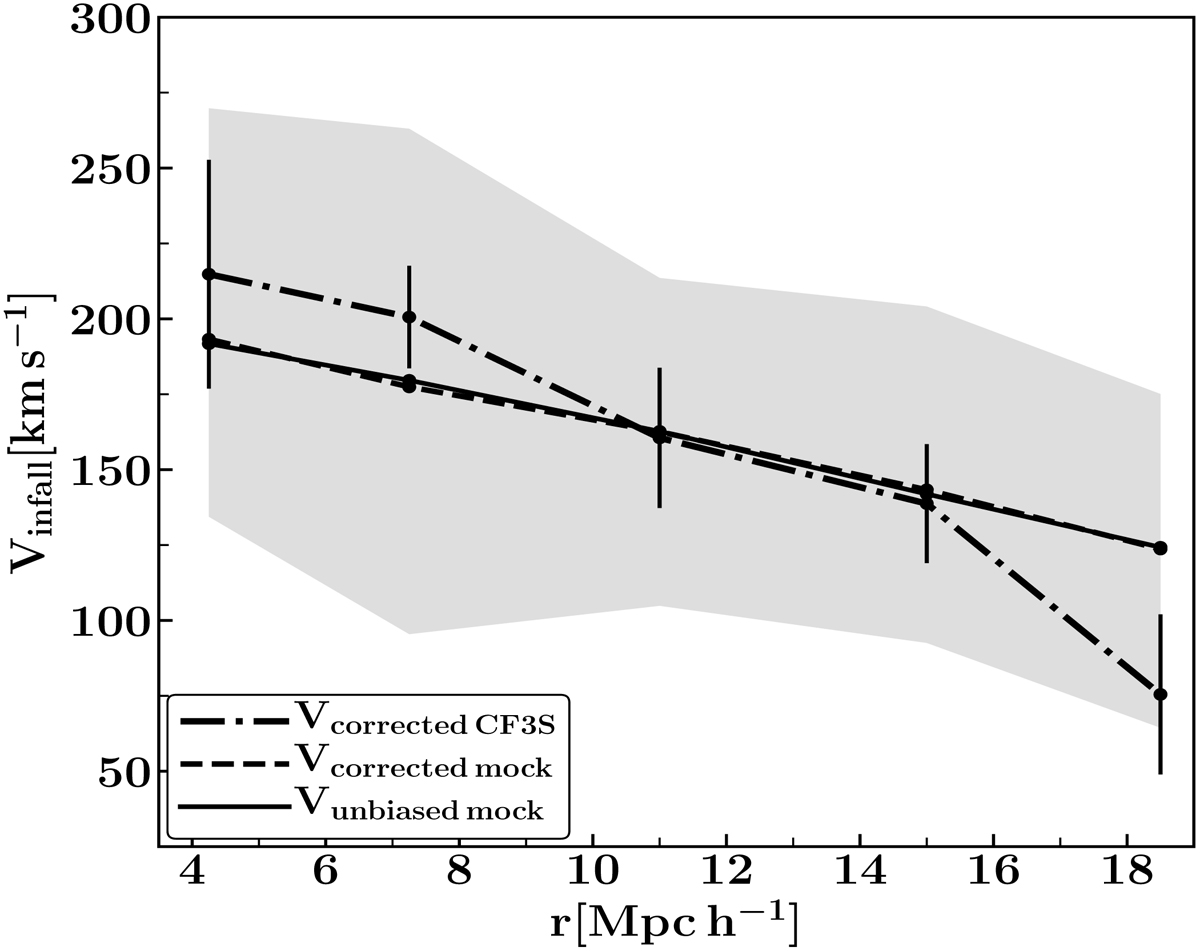
Mean infall velocity as a function of distance to the group center for corrected samples. The dashed lines indicate the mean velocity obtained from the corrected mock catalogs, and the dot–dashed line corresponds to Cosmicflows–3 sample corrected (corrected CF3S). The solid lines correspond to the mean infall velocity for the unbiased mock catalogs shown in solid lines on Fig. 5. Error bars correspond to the uncertainty in the Vcorrected CF3S. The shaded regions indicate the variance obtained from the 25 corrected mock catalogs.
Current usage metrics show cumulative count of Article Views (full-text article views including HTML views, PDF and ePub downloads, according to the available data) and Abstracts Views on Vision4Press platform.
Data correspond to usage on the plateform after 2015. The current usage metrics is available 48-96 hours after online publication and is updated daily on week days.
Initial download of the metrics may take a while.