Fig. 5.
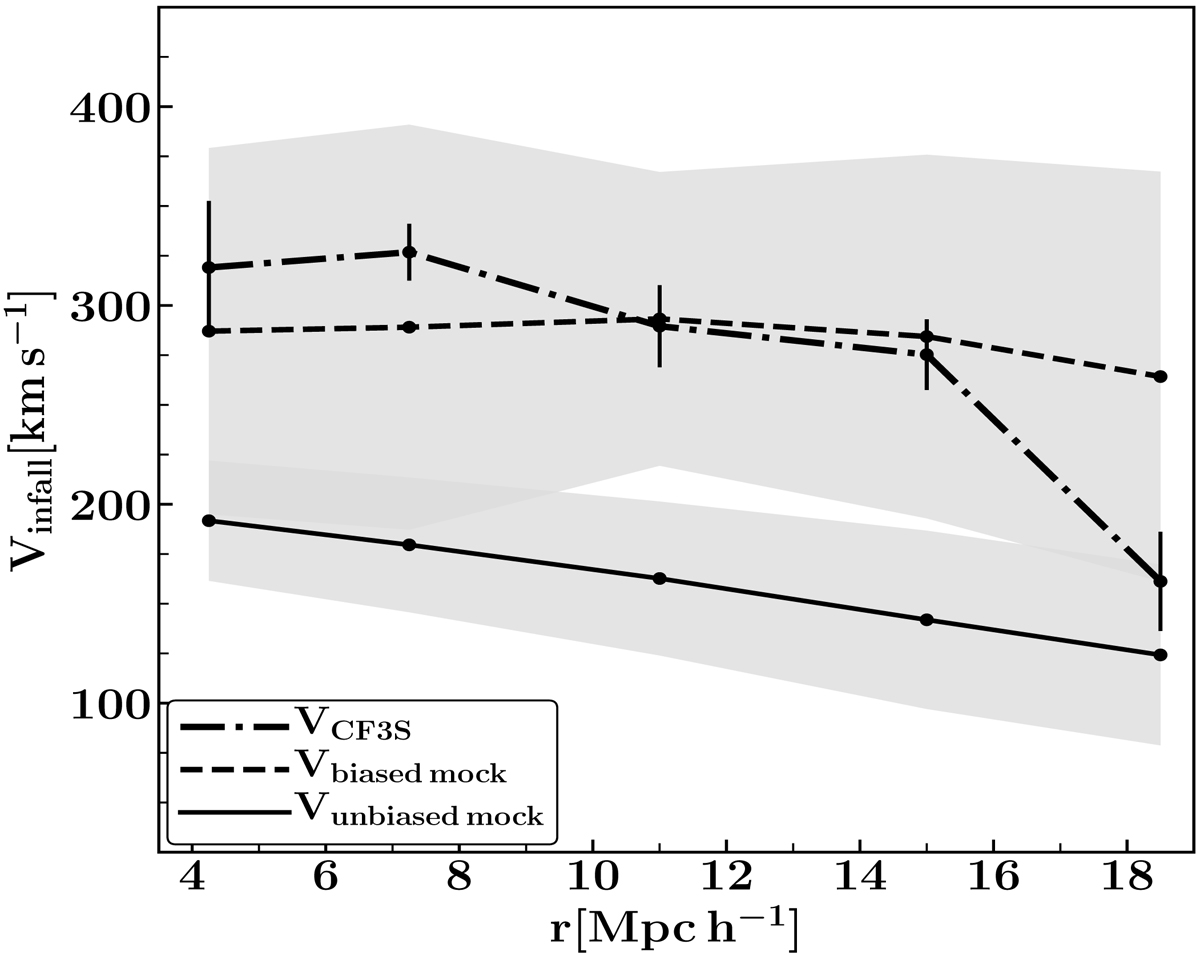
Mean infall velocity as a function of distance to the group center for biased samples. Dashed line indicates the mean velocity obtained from the mock with errors included (biased mock), and the dot-dashed line corresponds to the Cosmicflows-3 sample (CF3S). For comparison, we include the mean infall velocity for the unbiased mock(solid line). Error bars correspond to the uncertainty in the mean infall velocities from CF3S. The shaded region indicates the variance obtained from 25 mocks without (with) errors included in the catalog realizations.
Current usage metrics show cumulative count of Article Views (full-text article views including HTML views, PDF and ePub downloads, according to the available data) and Abstracts Views on Vision4Press platform.
Data correspond to usage on the plateform after 2015. The current usage metrics is available 48-96 hours after online publication and is updated daily on week days.
Initial download of the metrics may take a while.