Fig. 7.
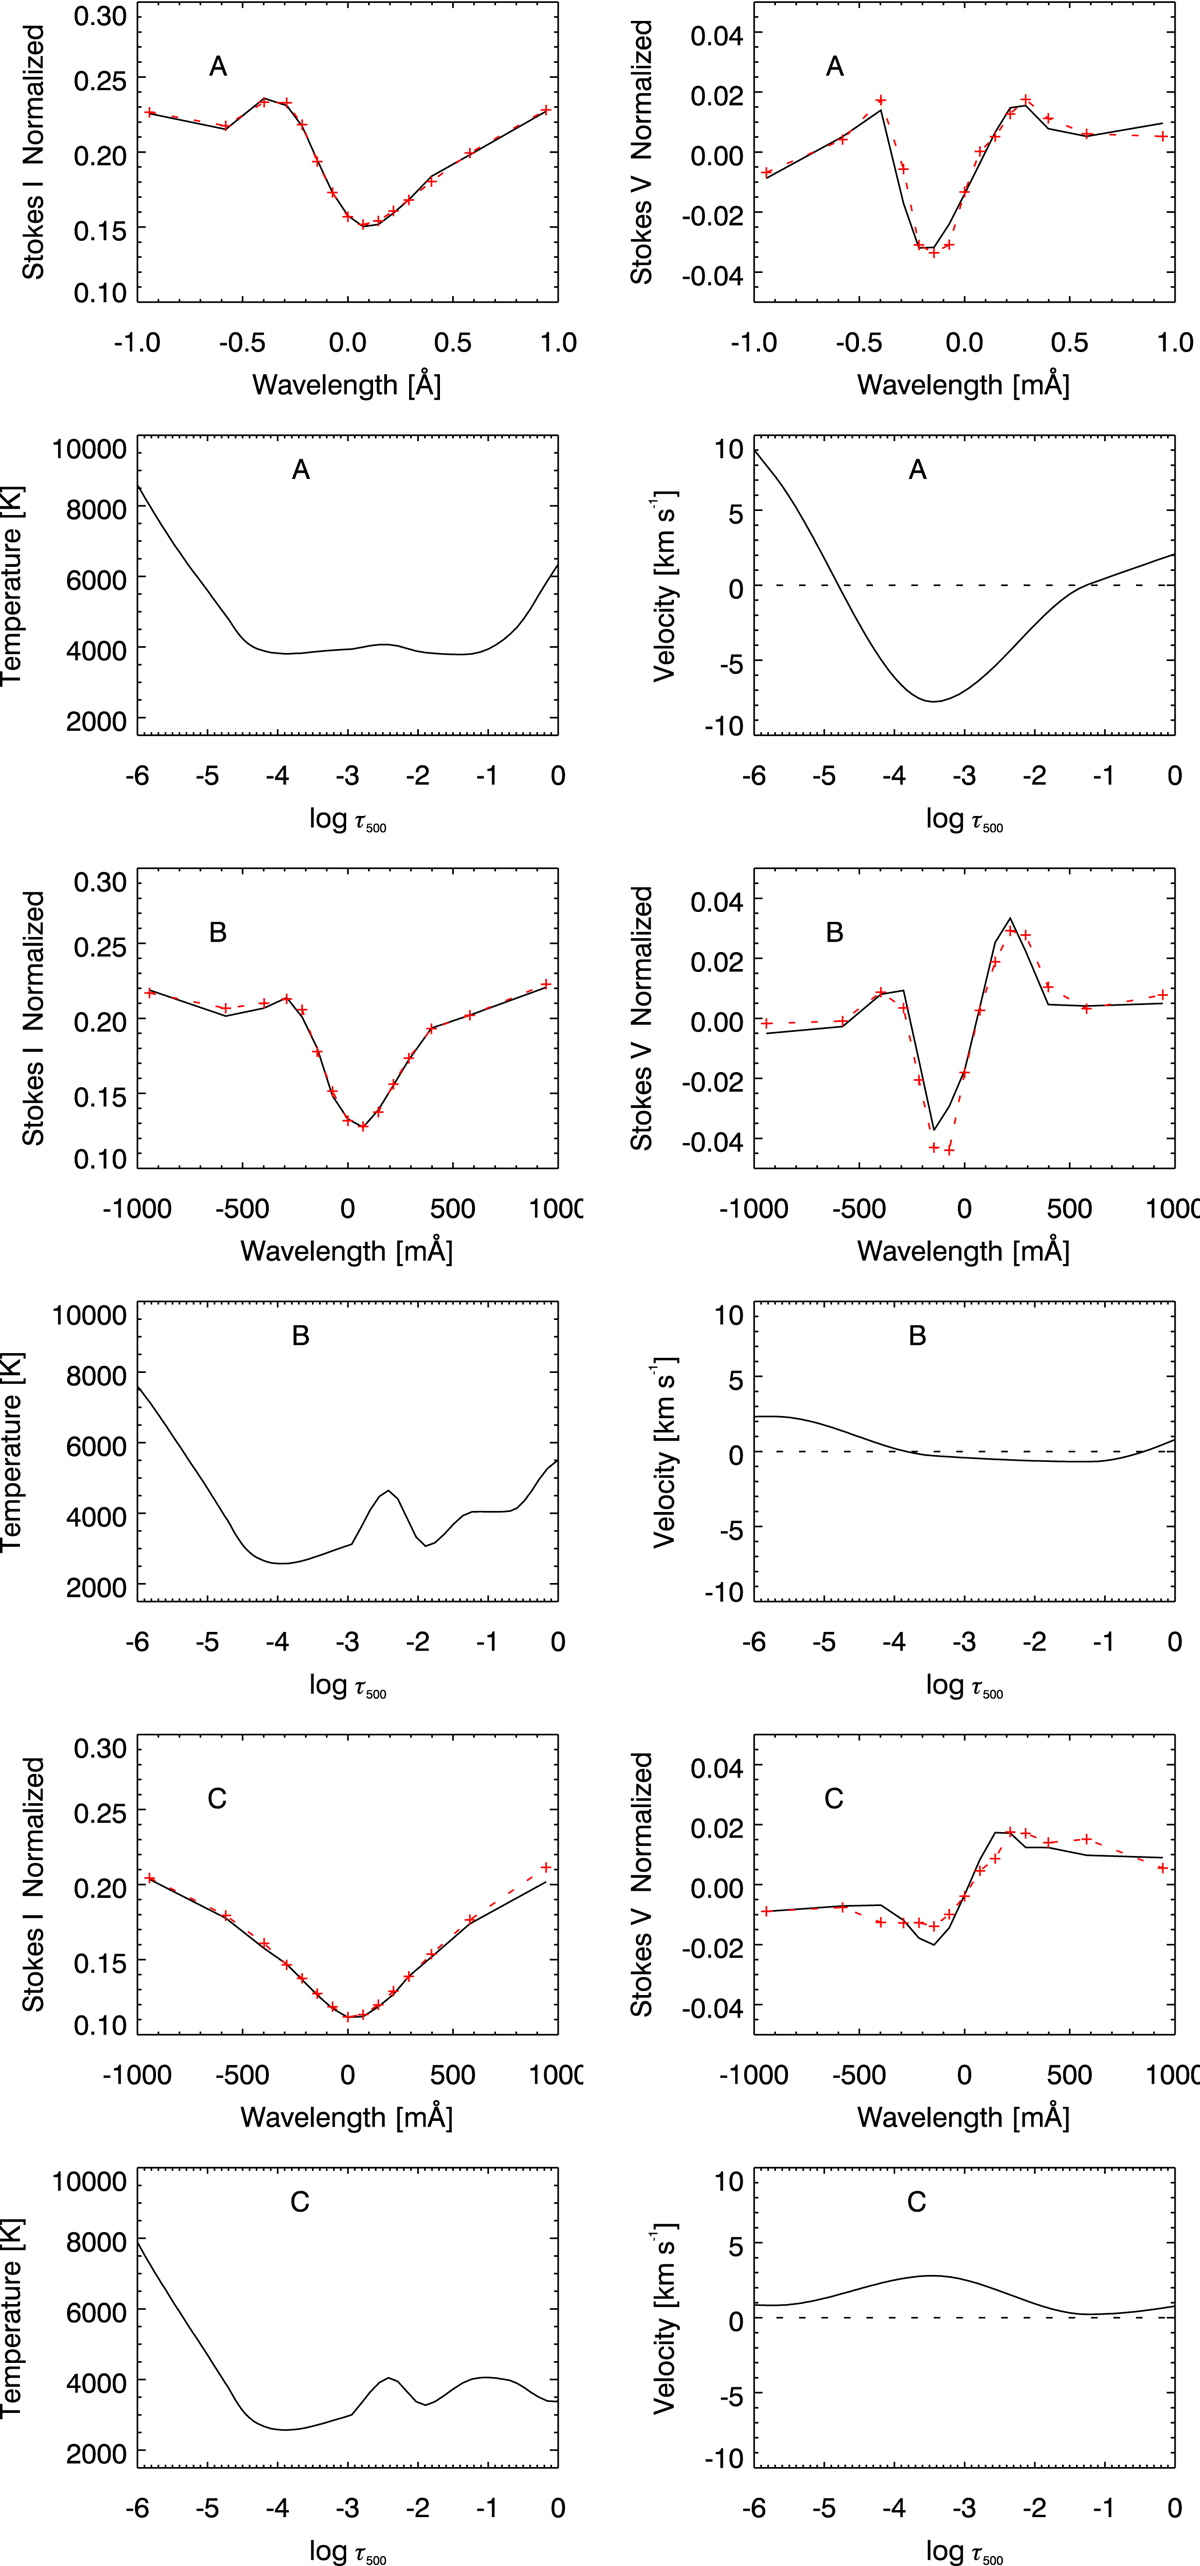
Inversion results for three SSUBs (A, B, and C as labelled) and respective fits. Stokes I and V profiles from the inversion procedure are shown by a solid black line, while the observed profiles are plotted by a red dashed line connecting the specific observed wavelengths denoted with crosses. Inverted temperature and velocity are shown as a function of optical depth at 500 nm. A dashed black line indicates the zero velocity level with negative values standing for upflows. The inverted magnetic field strengths were 1.4 kG, 1.4 kG, and 1.3 kG gauss for cases A, B, and C, respectively.
Current usage metrics show cumulative count of Article Views (full-text article views including HTML views, PDF and ePub downloads, according to the available data) and Abstracts Views on Vision4Press platform.
Data correspond to usage on the plateform after 2015. The current usage metrics is available 48-96 hours after online publication and is updated daily on week days.
Initial download of the metrics may take a while.