Fig. 5.
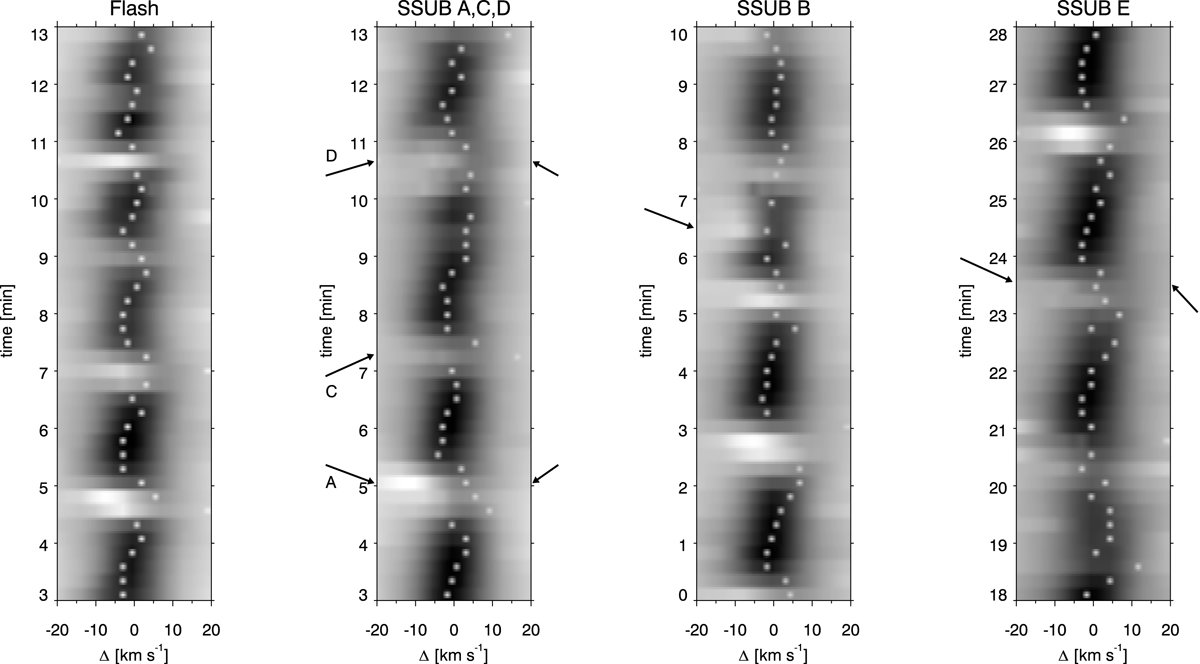
Spectral evolution in λ − t diagrams showing the blueshift to redshift of the Ca II 8542 Å line core between flashes (left panel) and SSUBs (right three panels). Cases from A to E as labelled. The black arrows from the left side indicate the moment of the SSUB and the right-side arrows indicate the darkening in the red wing caused by the collapsing SDF in the cases in which this is clearly visible. The sampled wavelength range is clipped to ±20 km s−1. Linear interpolation to a regular grid of 36.5 mÅ (1.28 km s−1) was used. The white dots indicate the Doppler shift of the core of the line for each spectral scan as obtained by a three-point parabola fit using the core and the ±146 mÅ wavelengths. This quantity is unreliable in the presence of strong brightenings and is added merely as an auxiliary to the eye when inspecting the profile evolution between bright events.
Current usage metrics show cumulative count of Article Views (full-text article views including HTML views, PDF and ePub downloads, according to the available data) and Abstracts Views on Vision4Press platform.
Data correspond to usage on the plateform after 2015. The current usage metrics is available 48-96 hours after online publication and is updated daily on week days.
Initial download of the metrics may take a while.