Fig. 2.
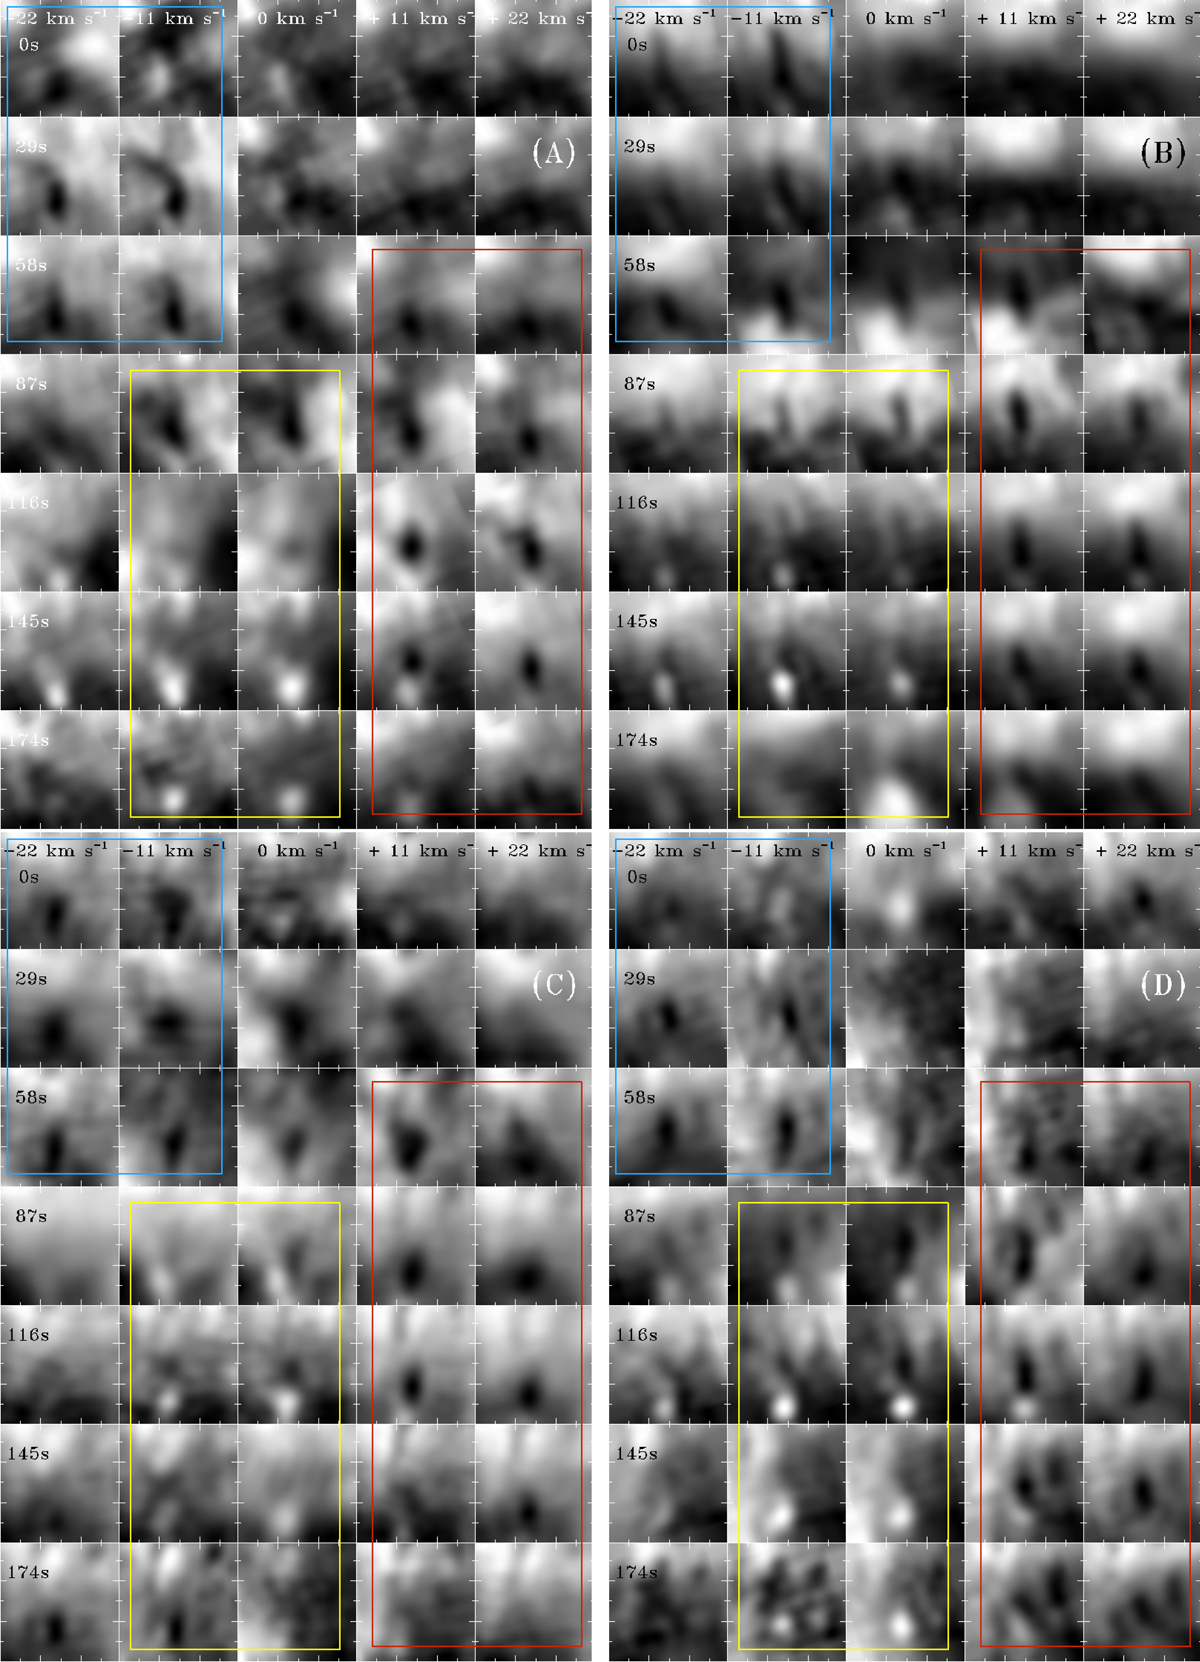
Evolution of four different SSUB/SDF pairs (events A to D). Each sub-field is an image at a given bandpass, labelled in velocity units from line core, and a given time in seconds from the approximate onset of the SDF. Thus, blueshift to redshift is shown from left to right and time evolution is indicated from top down. The coloured boxes highlight different stages of evolution of the SSUB/SDF pairs as described in the text. The blue box highlights the upflowing/growth stage of the SDF, red the downflowing stage, and yellow the corresponding SSUB flash. Major tickmarks are shown every ![]() .
.
Current usage metrics show cumulative count of Article Views (full-text article views including HTML views, PDF and ePub downloads, according to the available data) and Abstracts Views on Vision4Press platform.
Data correspond to usage on the plateform after 2015. The current usage metrics is available 48-96 hours after online publication and is updated daily on week days.
Initial download of the metrics may take a while.