Fig. 13.
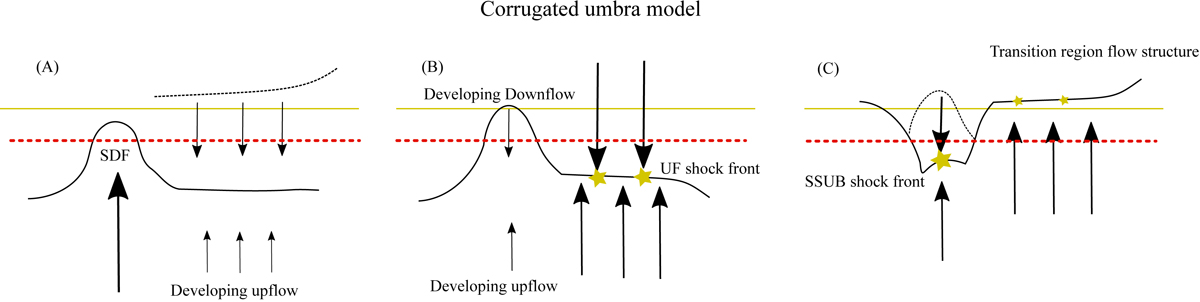
Simple model of umbral flashes including SDFs and SSUBs as part of a broader corrugated structure. The panels sequentially illustrate the cyclic state of the chromosphere of the umbra (i.e. time progresses from A to B to C to A and so on) with small arrows indicating a developing flow, large arrows a strong mass flow, and the solid line indicating the surface where the velocity gradient is highest. The dashed black line in (A) and (C) indicates the previous position of the black line as reference. The yellow stars indicate shocks with size proportional to the strength of the shock, the yellow line indicates the absolute maximum height in the atmosphere that still contributes to line formation, and the dashed red line indicates the monochromatic τ = 1 surface for the line minimum of Ca II 8542 Å.
Current usage metrics show cumulative count of Article Views (full-text article views including HTML views, PDF and ePub downloads, according to the available data) and Abstracts Views on Vision4Press platform.
Data correspond to usage on the plateform after 2015. The current usage metrics is available 48-96 hours after online publication and is updated daily on week days.
Initial download of the metrics may take a while.