Fig. 11.
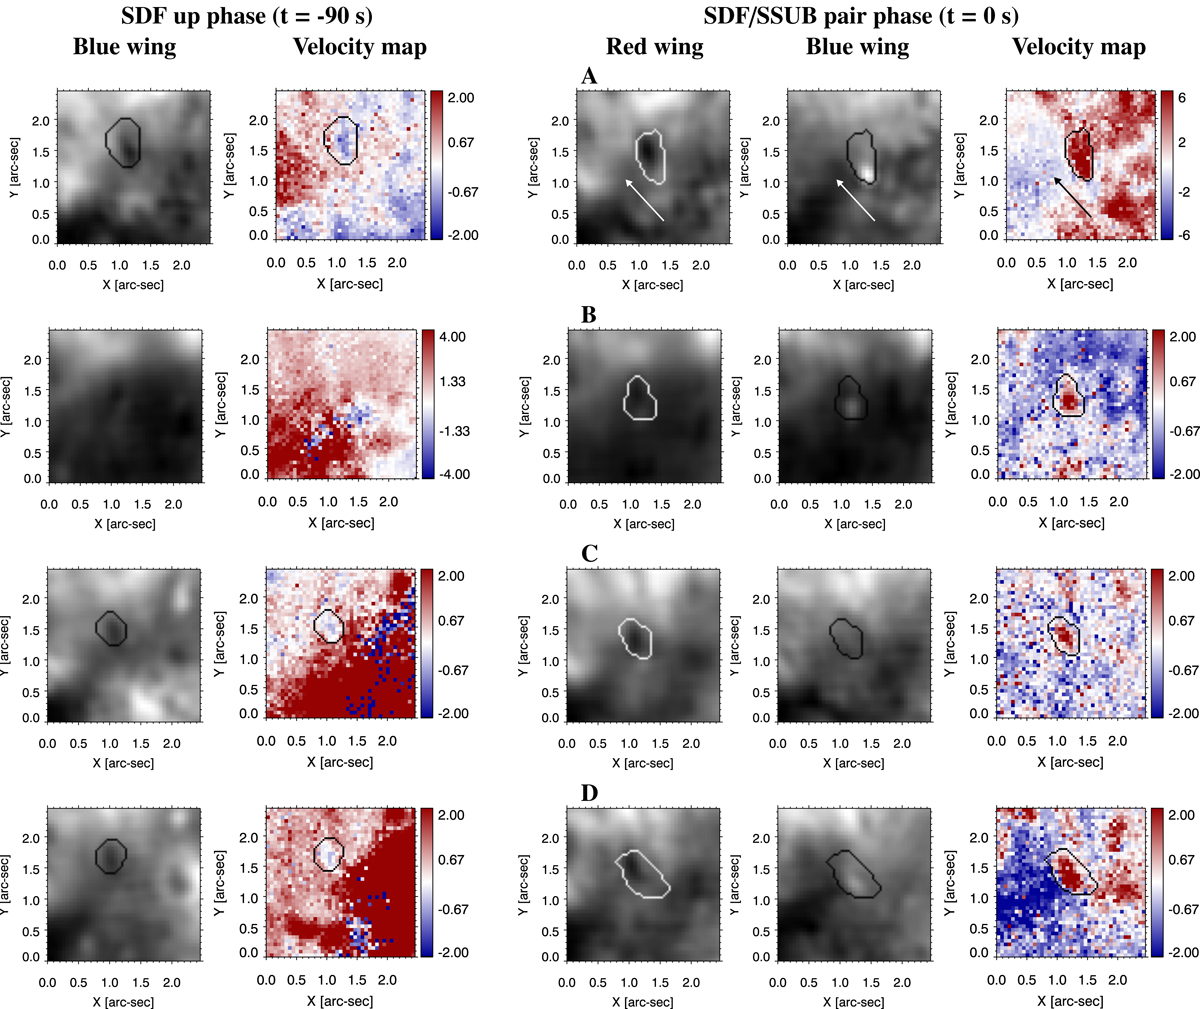
Narrow-band images and inverted velocity maps where downflowing structures matching the SDF/SSUB pairs are highlighted for four different cases (A to D as labelled). First column: upflowing stage of the SDFs as seen at −220 mÅ, 90 s before the SSUB. Second column: velocity map obtained from the respective inversions (i.e. from the full spectra and full FOV 90 s before the SSUBs) where the values were averaged between log τ500 = −4.5 and −5.5. Third column: down phase of the SDF, consecutive with the SSUB, as seen at +220 mÅ. Fourth column: SSUB, as visible at −220 mÅ. Last column: velocity map obtained from the inversions where the values were averaged between log τ500 = −4 and −5. The contours highlight continuous regions automatically selected based on the presence of a flowing area that differs from the background. The arrow in case A highlights the “flash” location plotted in Figs. 5 and 7.
Current usage metrics show cumulative count of Article Views (full-text article views including HTML views, PDF and ePub downloads, according to the available data) and Abstracts Views on Vision4Press platform.
Data correspond to usage on the plateform after 2015. The current usage metrics is available 48-96 hours after online publication and is updated daily on week days.
Initial download of the metrics may take a while.