Fig. 10.
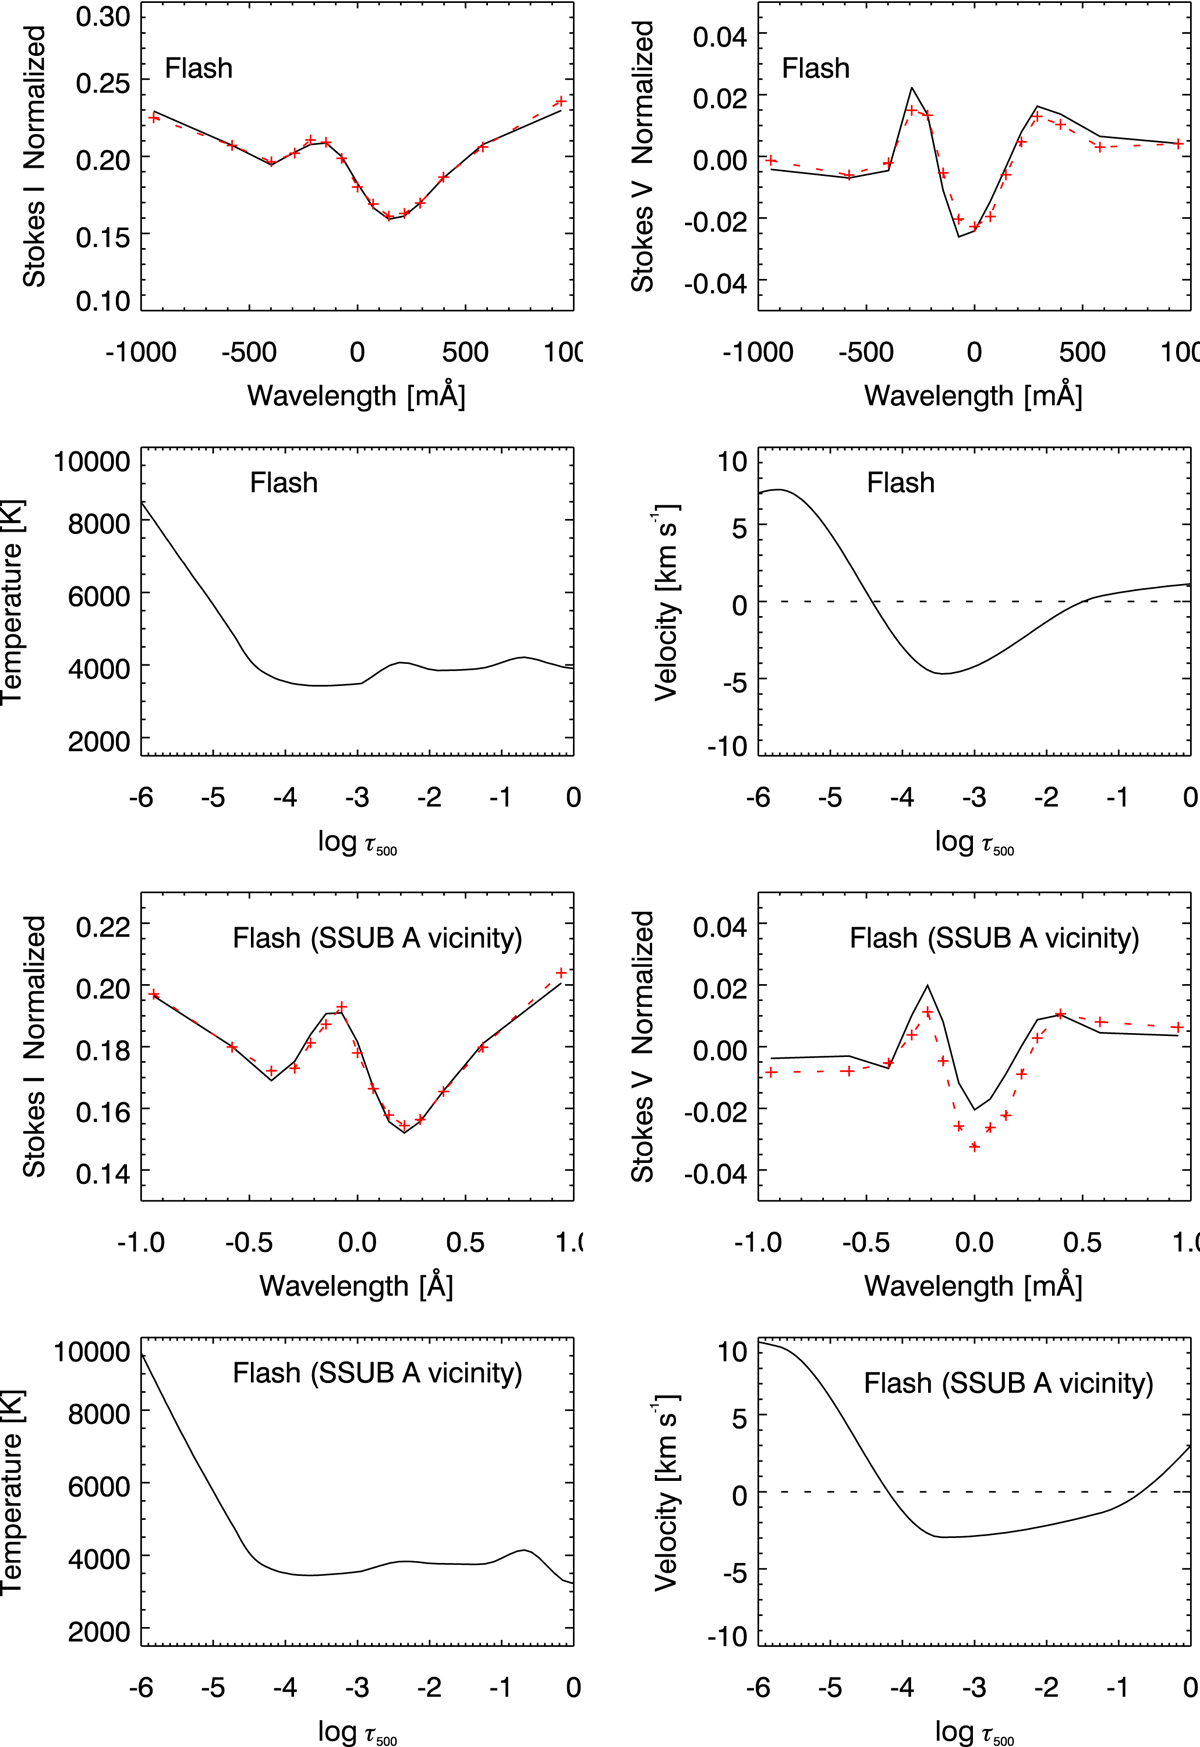
Profiles and inversion results for two umbral flashes showing both up and downflows along the vertical. Stokes I and V profiles, inverted temperature, and velocity as a function of optical depth at 500 nm are plotted as labelled. Synthetic profiles from the inversion procedure are shown by a solid black line while the observed profiles are plotted in a dashed-red line connection symbols at the observed wavelengths. The inverted magnetic field (single node) for the top panel was 1.4 kG and 1.3 kG for the bottom panel. Bottom panel: inverted flashed occurred in the vicinity of SSUB A 30 s earlier.
Current usage metrics show cumulative count of Article Views (full-text article views including HTML views, PDF and ePub downloads, according to the available data) and Abstracts Views on Vision4Press platform.
Data correspond to usage on the plateform after 2015. The current usage metrics is available 48-96 hours after online publication and is updated daily on week days.
Initial download of the metrics may take a while.