Fig. 1.
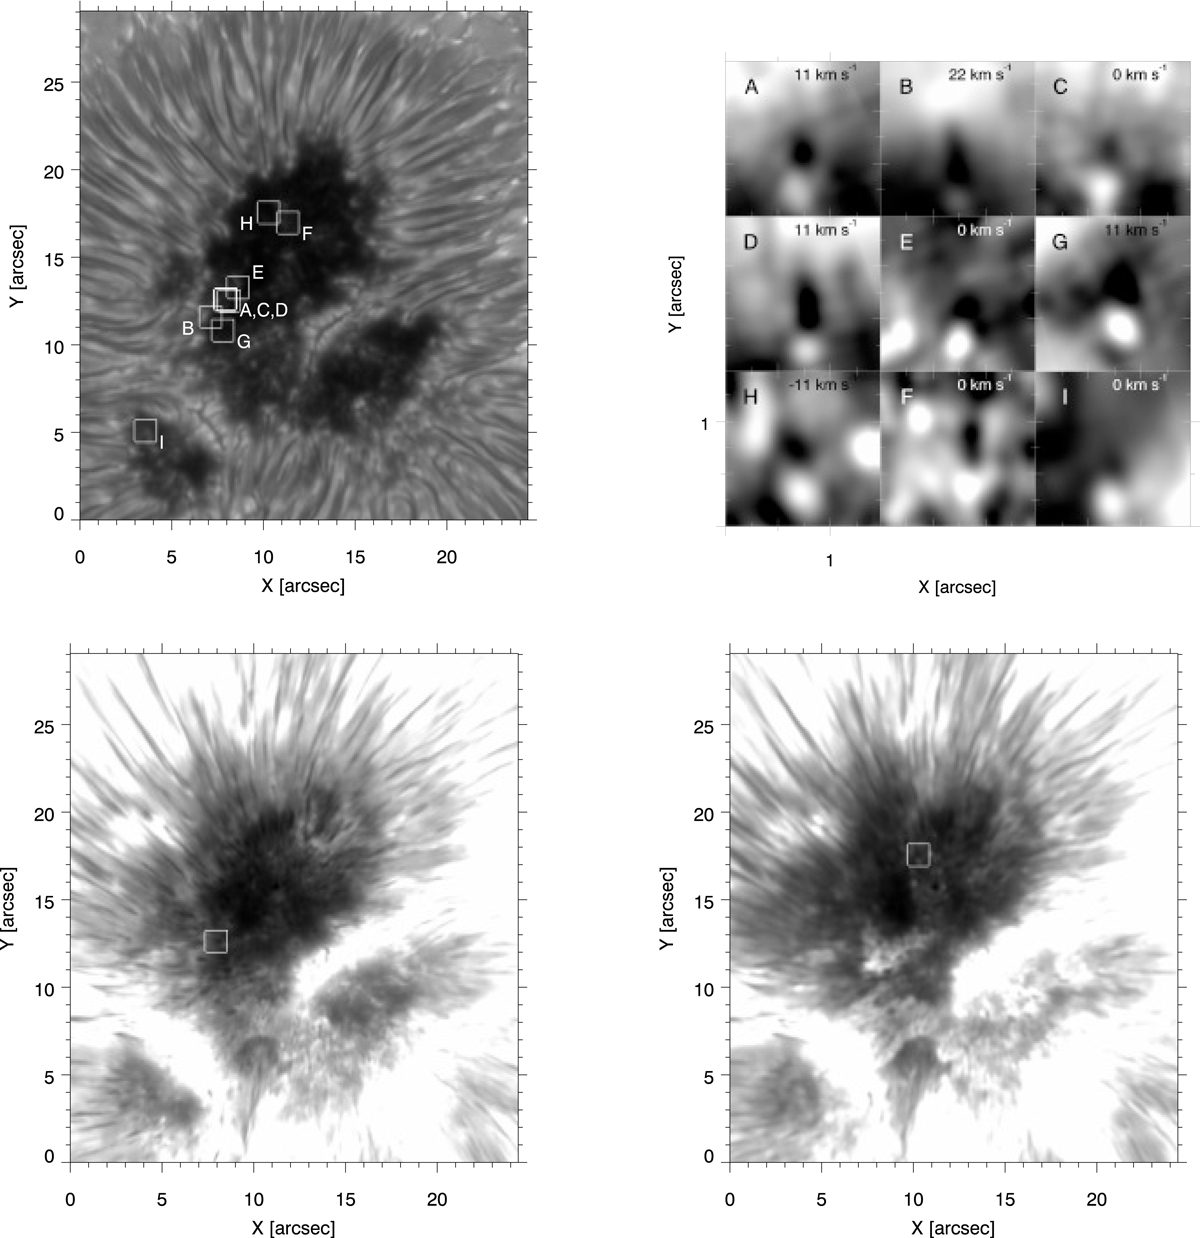
Overview of the nine selected SDF/SSUB events. Top left panel: context Ca II 8542 Å far wing image (−942 mÅ) with the location of the events denoted with small squares, delineating the exact areas that are analysed using inversions. The nine sub-images at the top-right show the SDF–SSUB pairs at their clearest visibility and are selected from Figs. 2–4. These correspond to the fields of view shown in the top left panel with a rotation applied such that the SDF–SSUB pairs are aligned along the y-axis. In all cases the dark SDFs are seen just above the bright SSUBs. The central wavelength of each passband is written in units of Doppler shift from the core. Bottom panels: two SDF–SSUB pairs in context. An image of the line core, scaled such that 30% of the pixels are saturated, is shown at the bottom left. The box highlights SDF–SSUB pair A. Bottom right panel: image taken at +145 mÅ from the line core, with the same 30% saturation, where SDF–SSUB pair H is highlighted with a box. This latter selection perfectly matches the respective image in the top right panel as no rotation was applied.
Current usage metrics show cumulative count of Article Views (full-text article views including HTML views, PDF and ePub downloads, according to the available data) and Abstracts Views on Vision4Press platform.
Data correspond to usage on the plateform after 2015. The current usage metrics is available 48-96 hours after online publication and is updated daily on week days.
Initial download of the metrics may take a while.