Fig. 9.
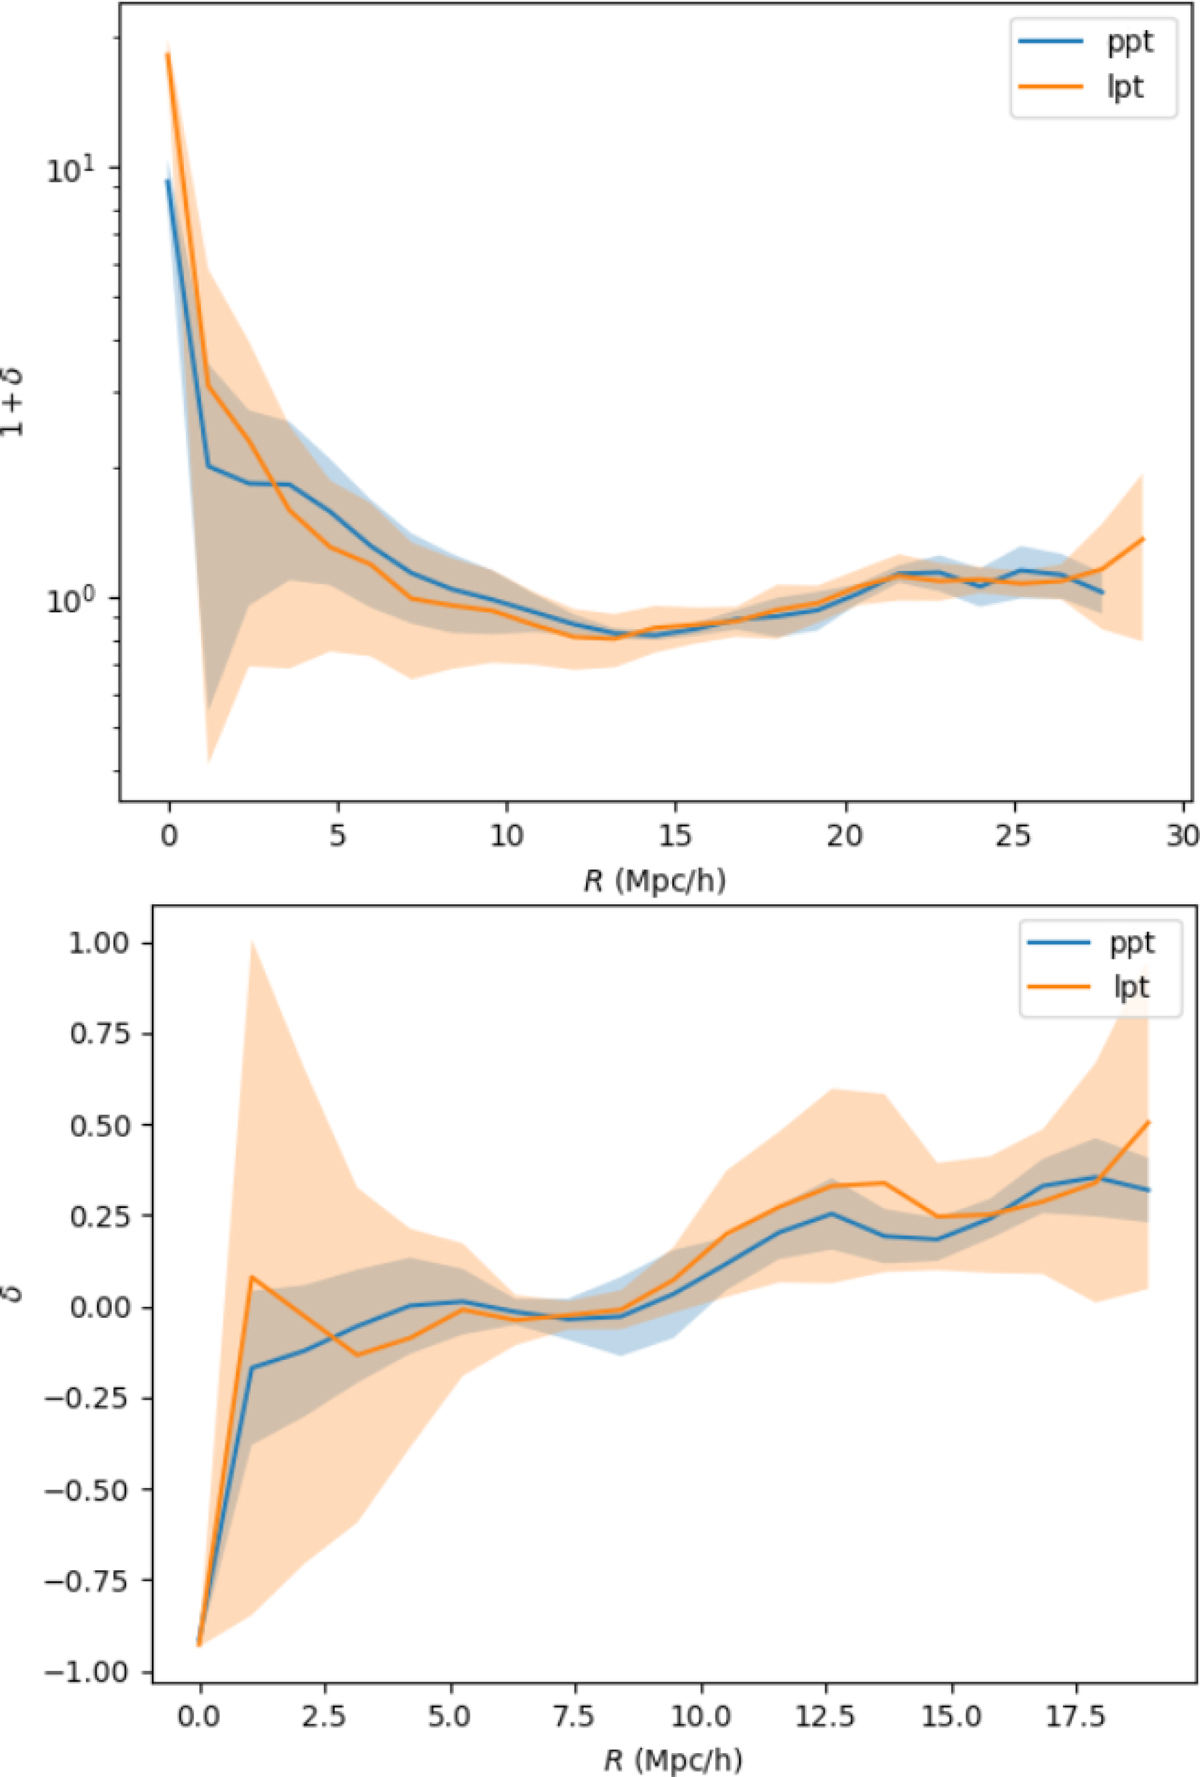
Comparison of density profiles obtained with PPT and LPT. Upper panel: cluster density profile obtained by evolving the same initial conditions with PPT and LPT. Lower panel: test for a void profile. This demonstrates that PPT and LPT provide equivalent cosmic structures. The shaded regions indicate the uncertainty region of the profiles, corresponding to the standard deviation of 50 realisations. While the PPT and LPT show similar uncertainty regions for the cluster profile, the LPT has a larger standard deviation than the PPT in the void profile. This larger uncertainty is due to the poor sampling of the voids in the LPT model since most of the particles cluster in high-density regions.
Current usage metrics show cumulative count of Article Views (full-text article views including HTML views, PDF and ePub downloads, according to the available data) and Abstracts Views on Vision4Press platform.
Data correspond to usage on the plateform after 2015. The current usage metrics is available 48-96 hours after online publication and is updated daily on week days.
Initial download of the metrics may take a while.