Fig. 8.
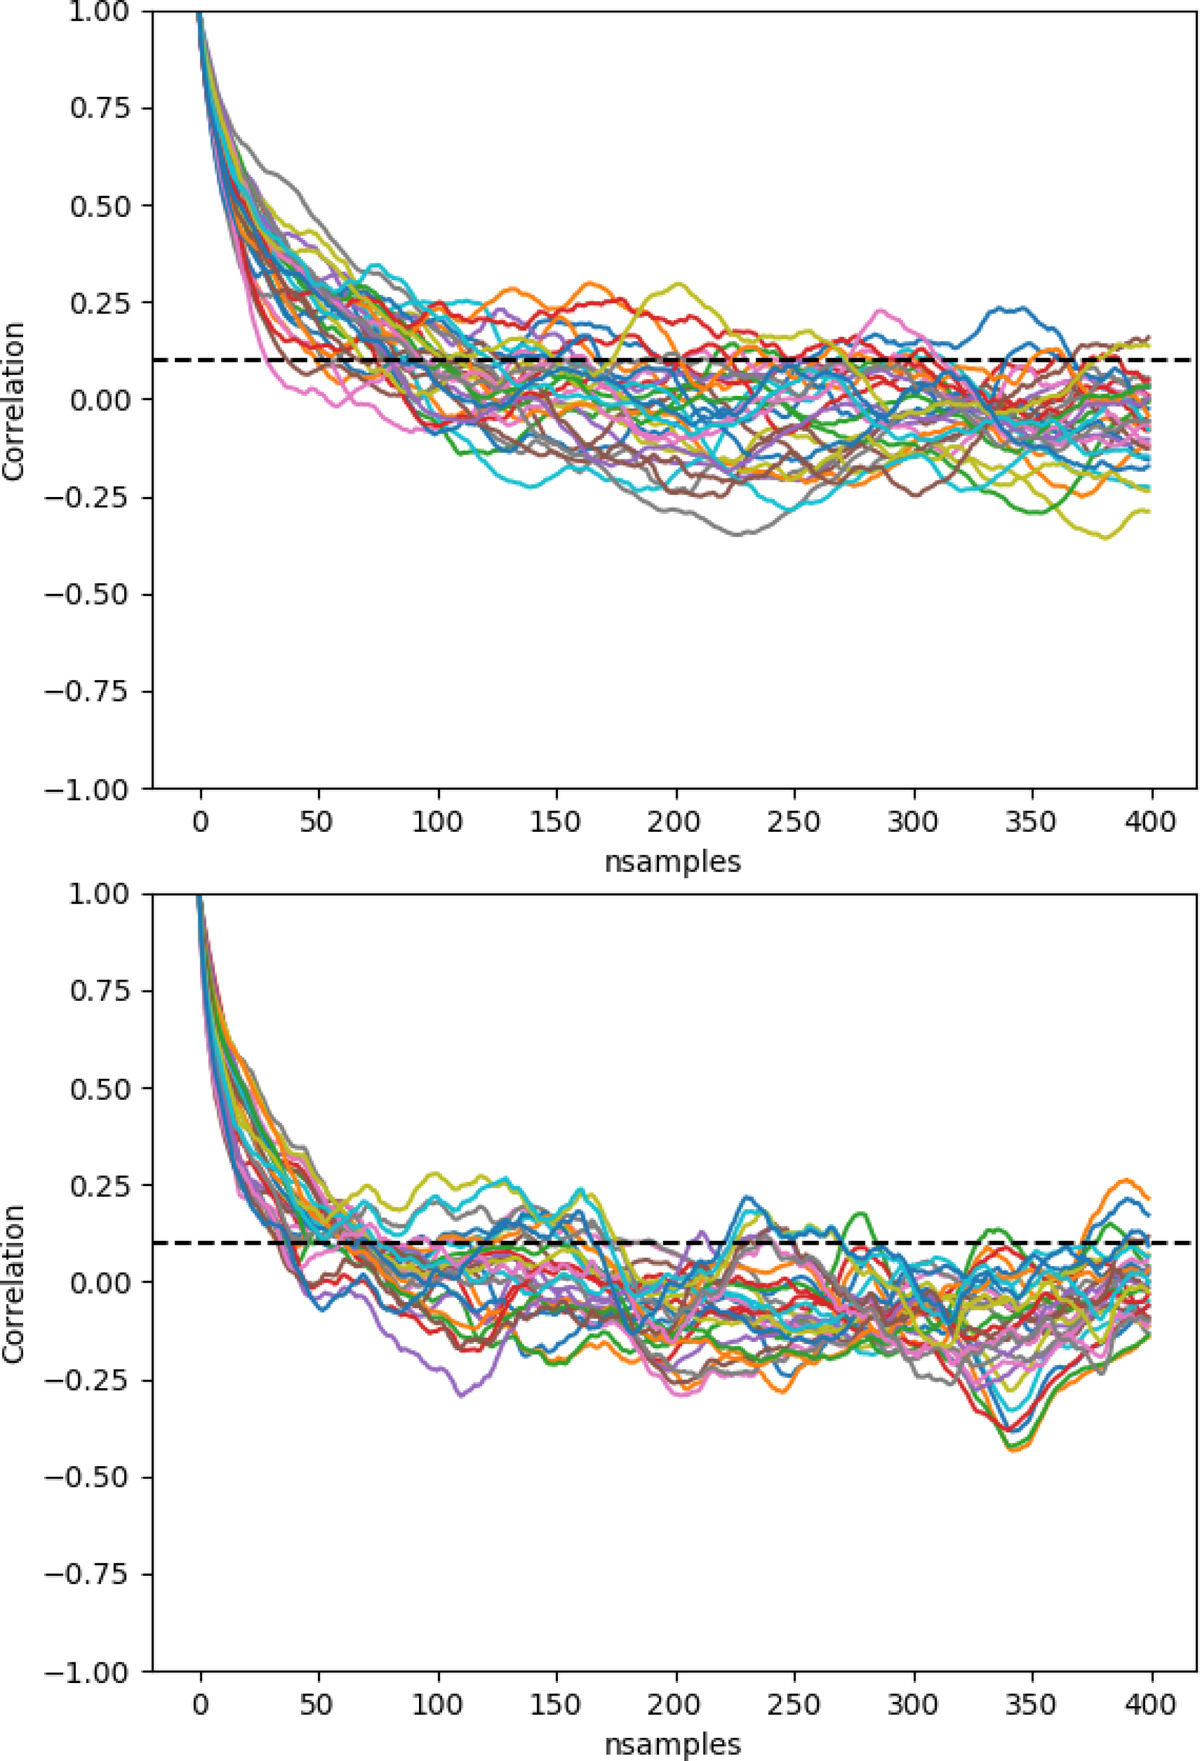
Autocorrelation of the density amplitudes as a function of the sample lag in the Markov chain for LPT (upper panel) and PPT (lower panel). This autocorrelation is estimated from 2000 samples after the warm-up phase. The correlation length of the sampler can be estimated by determining the point when correlations drop below 0.1 for the first time. The annealing with the PPT model does not introduce longer correlations in the density sampler.
Current usage metrics show cumulative count of Article Views (full-text article views including HTML views, PDF and ePub downloads, according to the available data) and Abstracts Views on Vision4Press platform.
Data correspond to usage on the plateform after 2015. The current usage metrics is available 48-96 hours after online publication and is updated daily on week days.
Initial download of the metrics may take a while.