Fig. 7.
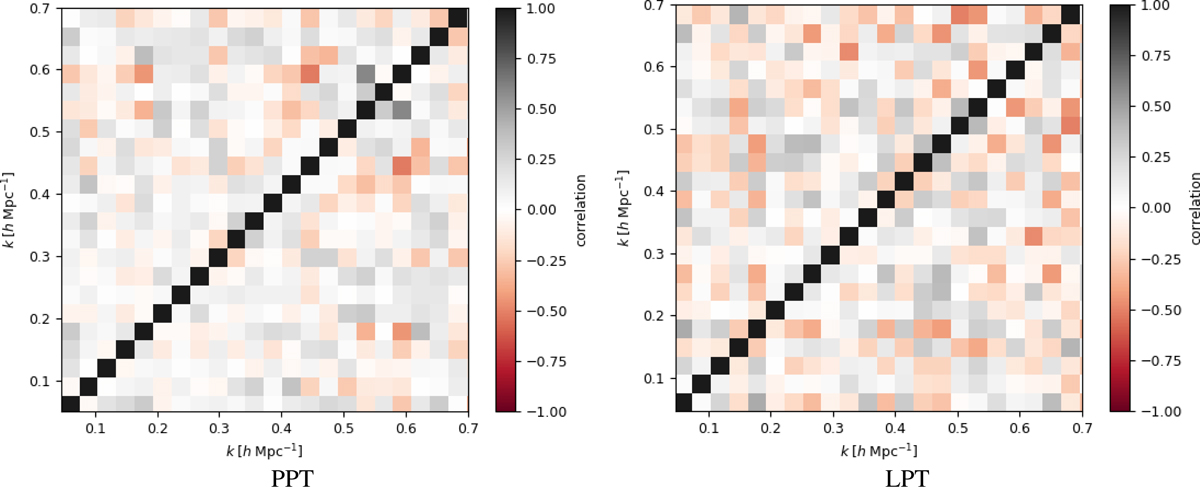
Estimated correlation matrix of power spectrum amplitudes with the mean value, normalised using the variance of amplitudes of the power spectrum modes, for PPT (left panel) and LPT (right panel). We computed the correlation matrix from 600 samples after the warm-up phase. The low off-diagonal terms indicate that the annealing method does not introduce any erroneous mode coupling.
Current usage metrics show cumulative count of Article Views (full-text article views including HTML views, PDF and ePub downloads, according to the available data) and Abstracts Views on Vision4Press platform.
Data correspond to usage on the plateform after 2015. The current usage metrics is available 48-96 hours after online publication and is updated daily on week days.
Initial download of the metrics may take a while.