Fig. 5.
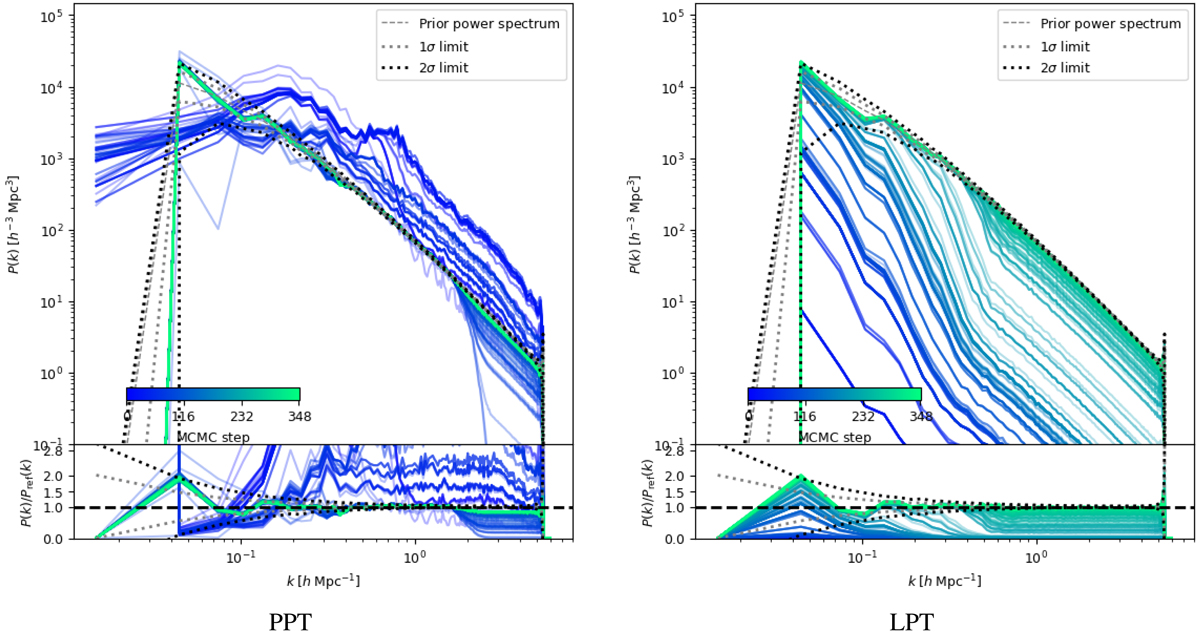
Burn-in of the posterior initial matter power spectra. Left panel: corresponds to PPT with annealing, and the right panel corresponds to standard LPT. The colour scale shows the evolution of the matter power spectrum with the number of samples. The dashed lines indicate the underlying power spectrum and the 1- and 2-σ cosmic variance limits. The Markov chain is initialised with a Gaussian initial density field scaled by a factor 10−3 and the amplitudes of the power spectrum systematically drift towards the fiducial values, recovering the true matter power spectrum at the end of the warm-up phase. Monitoring this drift allows us to identify when the Markov chain approaches a stationary distribution and provides unbiased estimates of the target distribution. The annealing with PPT reduces significantly the number of samples required in the warm-up phase, moving the chain faster to the target distribution. This is achieved by first sampling the coarser scales and gradually allowing the algorithm to respond to increasingly finer scales.
Current usage metrics show cumulative count of Article Views (full-text article views including HTML views, PDF and ePub downloads, according to the available data) and Abstracts Views on Vision4Press platform.
Data correspond to usage on the plateform after 2015. The current usage metrics is available 48-96 hours after online publication and is updated daily on week days.
Initial download of the metrics may take a while.