Fig. 2.
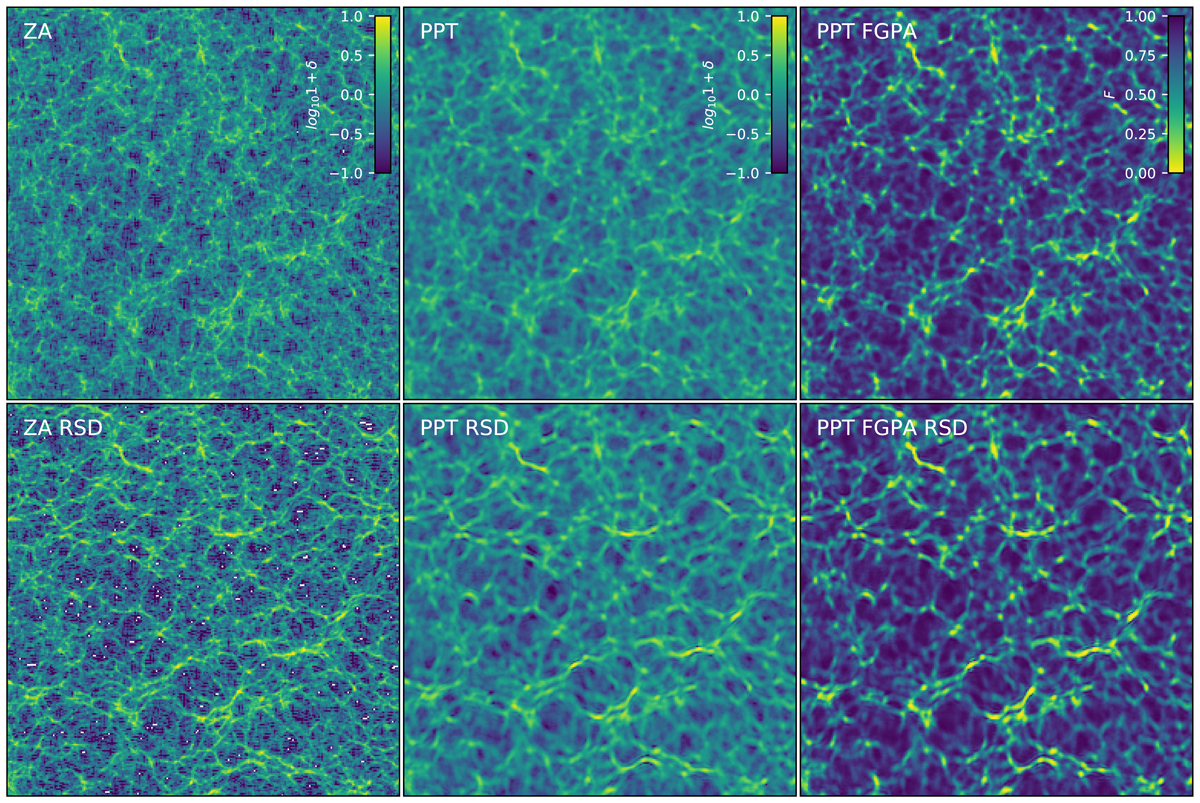
Density fields (left and middle column) and quasar flux field in the FGP approximation (right column) in physical space (top panels) and in redshift space (bottom panels), with the line-of-sight direction upwards. Leftmost panels: use the Zel’dovich approximation and CIC deposit, the others use the PPT formalism. In all cases we used 2563 resolution elements, the box size (and extent of each image) used for this comparison is 256 h−1 Mpc at z = 2.5. The thickness of the projected slice is 2 h−1 Mpc and white pixels in the CIC panels indicate zero particles deposited.
Current usage metrics show cumulative count of Article Views (full-text article views including HTML views, PDF and ePub downloads, according to the available data) and Abstracts Views on Vision4Press platform.
Data correspond to usage on the plateform after 2015. The current usage metrics is available 48-96 hours after online publication and is updated daily on week days.
Initial download of the metrics may take a while.