Fig. 13.
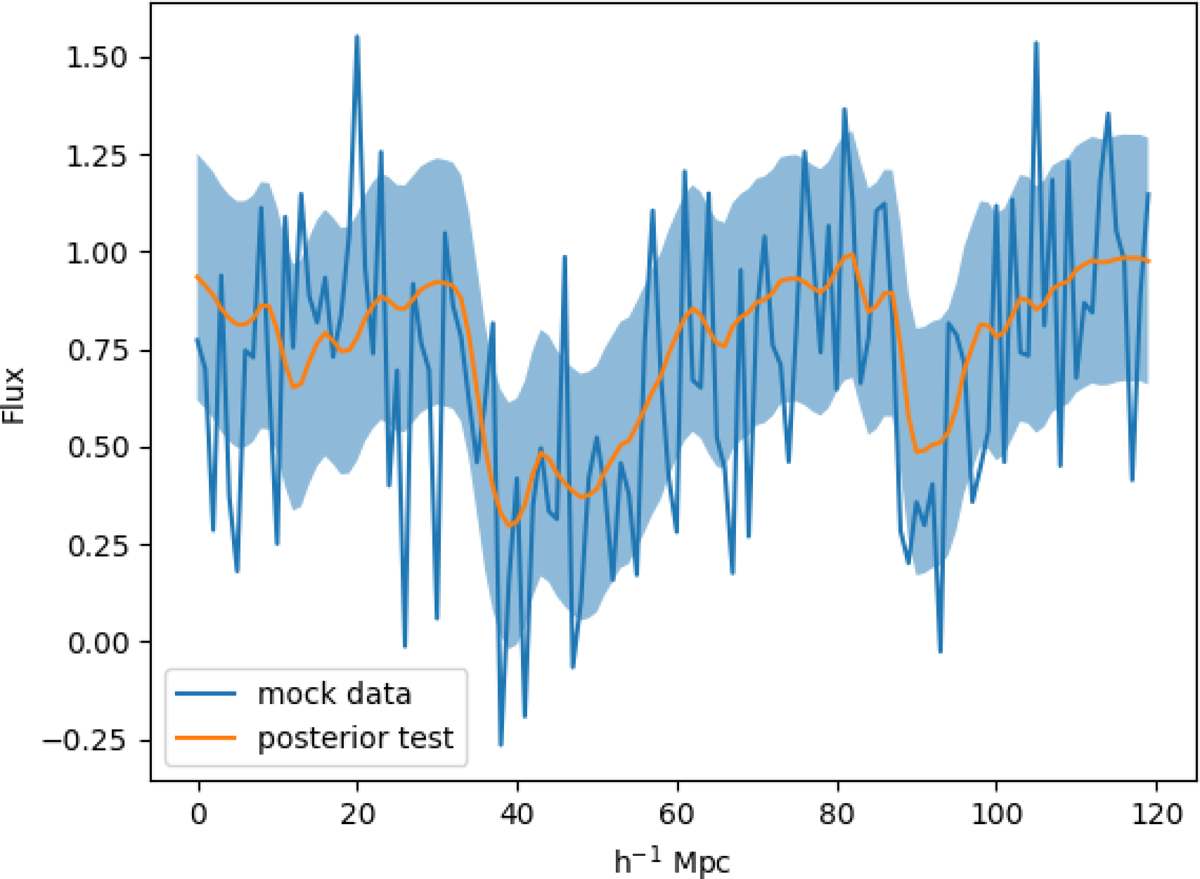
Posterior predictive flux for a spectrum with noise σ = 0.03. The posterior predicted flux (orange line) is computed from the ensemble mean optical depth field in redshift space. The blue shaded region indicates the 1-σ region, corresponding to the standard deviation of the noise in this line of sight. This test checks whether the data model can accurately account for the observations. Any significant mismatch would immediately indicate a breakdown of the applicability of the data model or error of the inference framework. Our method recovers the transmitted flux fraction correctly within the noise uncertainty.
Current usage metrics show cumulative count of Article Views (full-text article views including HTML views, PDF and ePub downloads, according to the available data) and Abstracts Views on Vision4Press platform.
Data correspond to usage on the plateform after 2015. The current usage metrics is available 48-96 hours after online publication and is updated daily on week days.
Initial download of the metrics may take a while.