Fig. 11.
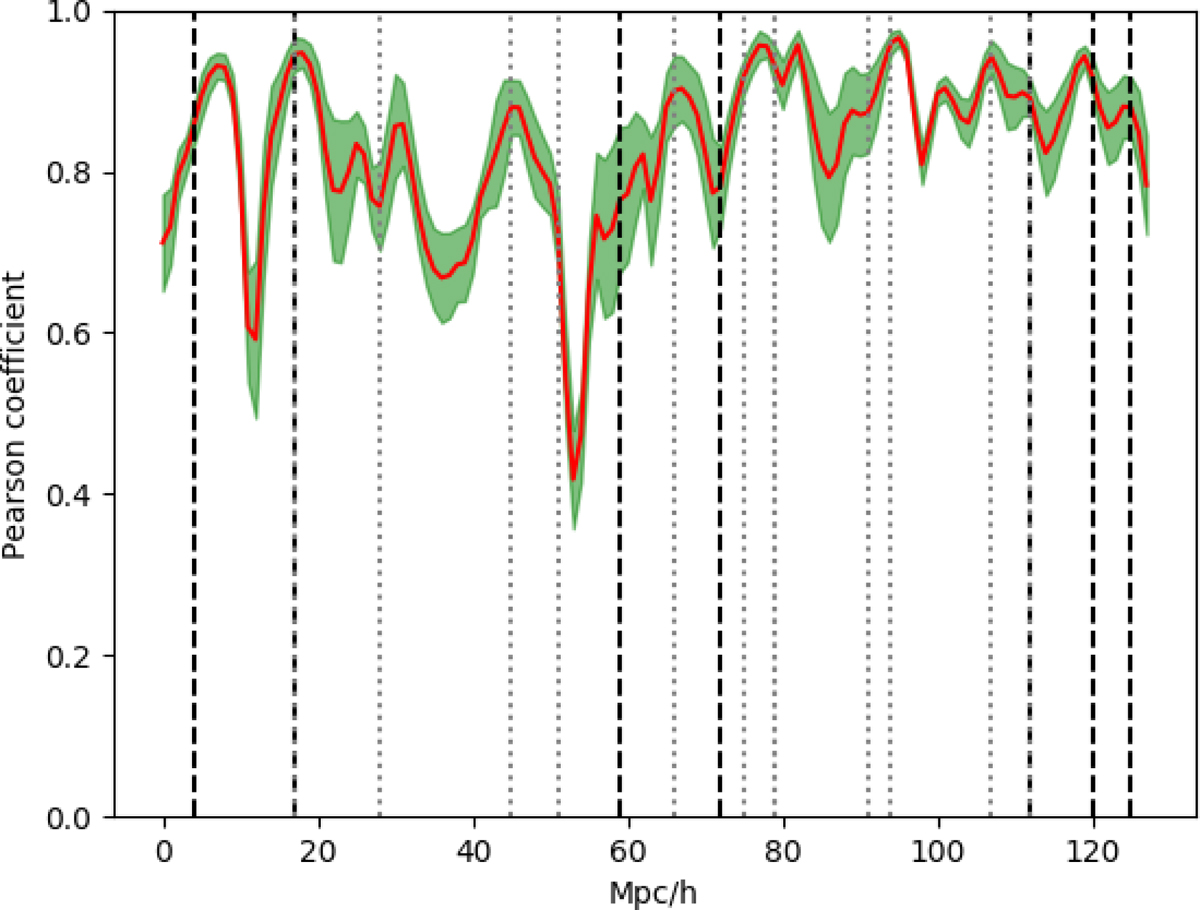
Pearson coefficient of the true density field and 300 density samples in our Markov chain. The red line corresponds to the mean of the correlation, and the shaded region indicates the standard deviation. The correlation is computed for a slice of width 1 h−1 Mpc (the x-axis indicate the position across this slice). The dashed lines indicate the position of the lines of sight in the slice, and the dotted lines indicate the position of lines of sight in neighbouring slices. The Pearson coefficient is > 0.7 at most of the locations in this slice, including regions where there are no neighbouring lines of sight. This indicates that the algorithm can interpolate the information between lines of sight and correctly recover the structures in unobserved regions.
Current usage metrics show cumulative count of Article Views (full-text article views including HTML views, PDF and ePub downloads, according to the available data) and Abstracts Views on Vision4Press platform.
Data correspond to usage on the plateform after 2015. The current usage metrics is available 48-96 hours after online publication and is updated daily on week days.
Initial download of the metrics may take a while.