Fig. 10.
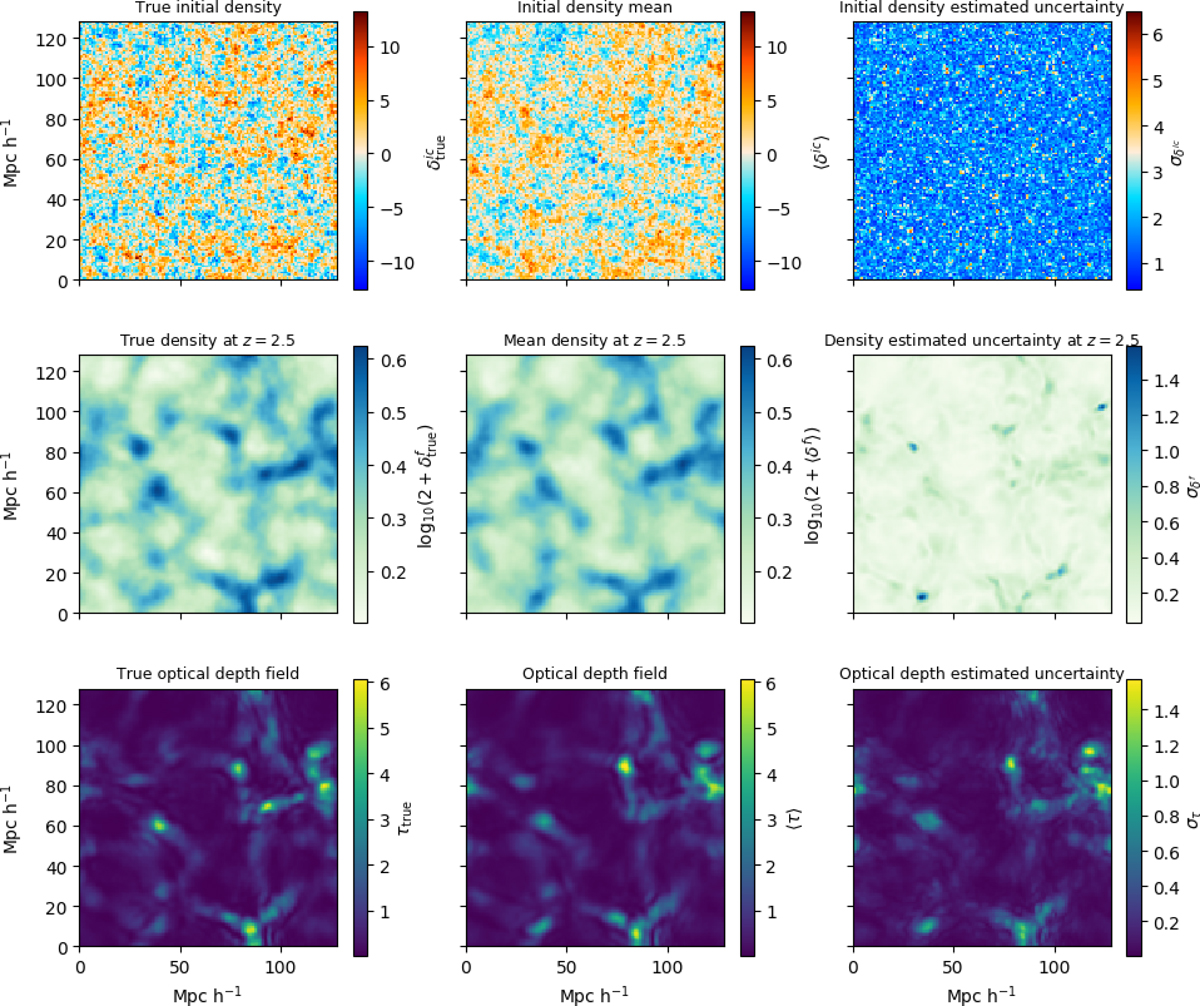
Slices through ground truth initial (left upper panel), true evolved density field (left middle panel), true optical depth field (left lower panel), inferred ensemble mean initial (middle upper panel), ensemble mean evolved (middle-lower panel) density field and ensemble mean optical depth (lower middle panel) computed from 600 MCMC samples. The density fields are in physical space, obtained with the PPT as indicated in Eq. (6). The optical depth field is in redshift space, corresponding to ![]() with χ from Eq. (13). Comparison between these panels shows that the method recovers the structure of the true density fields with high accuracy. Right panels: standard deviations of inferred amplitudes of initial (upper right panel), final density fields (middle right panel) and optical depth (lower right panel). We note that we plotted the standard deviation of the density σδf but the mean density is plotted as log10(2 + ⟨δf⟩). We note that the uncertainty of δf and of the optical depth present a structure that correlates with the corresponding field. In contrast, the standard deviation of the initial conditions are homogeneous and show no correlation with the initial density field, indicating that the dynamical model correctly propagates the information between the primordial matter fluctuations and the final density and absorption fields.
with χ from Eq. (13). Comparison between these panels shows that the method recovers the structure of the true density fields with high accuracy. Right panels: standard deviations of inferred amplitudes of initial (upper right panel), final density fields (middle right panel) and optical depth (lower right panel). We note that we plotted the standard deviation of the density σδf but the mean density is plotted as log10(2 + ⟨δf⟩). We note that the uncertainty of δf and of the optical depth present a structure that correlates with the corresponding field. In contrast, the standard deviation of the initial conditions are homogeneous and show no correlation with the initial density field, indicating that the dynamical model correctly propagates the information between the primordial matter fluctuations and the final density and absorption fields.
Current usage metrics show cumulative count of Article Views (full-text article views including HTML views, PDF and ePub downloads, according to the available data) and Abstracts Views on Vision4Press platform.
Data correspond to usage on the plateform after 2015. The current usage metrics is available 48-96 hours after online publication and is updated daily on week days.
Initial download of the metrics may take a while.