Fig. A.1.
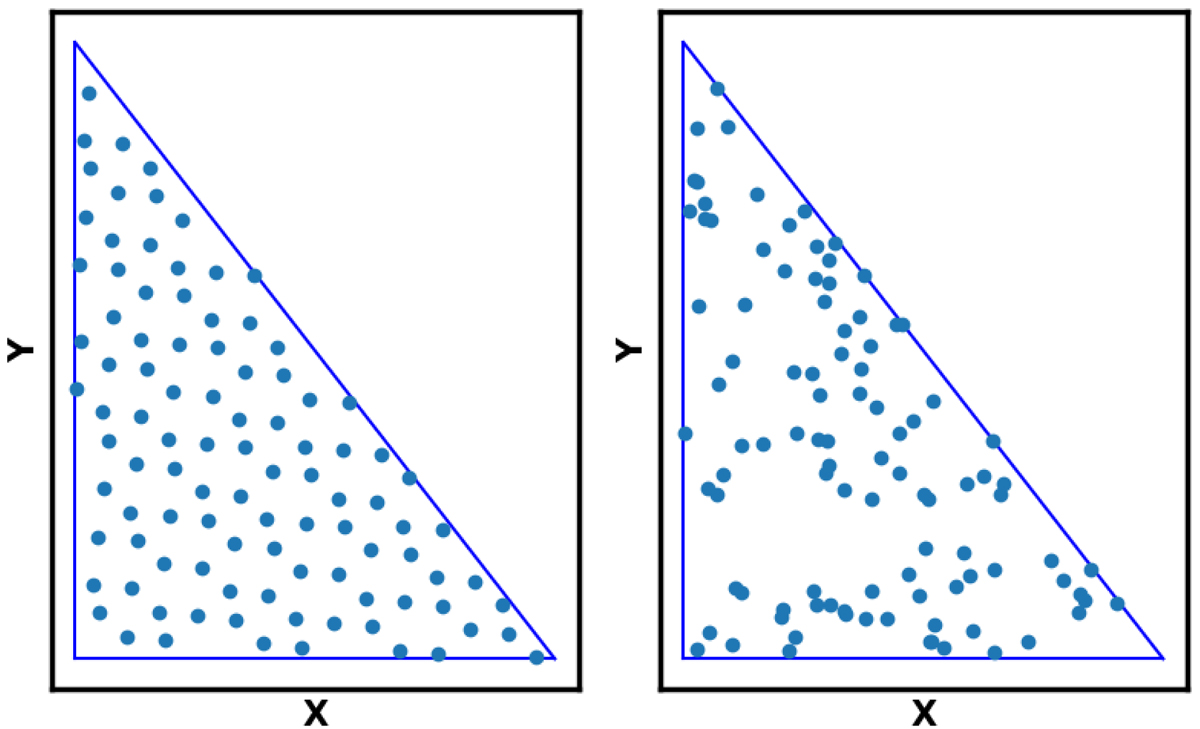
Left: one hundred sampling points distributed on a triangle via the R2 method, and (right) 100 sample points from a uniform random number generator mapped onto the same triangle. The low discrepancy (the largest possible distance among the points) of R2 method is well demonstrated, producing a homogeneous coverage that allows for a quick, implicit area subdivision.
Current usage metrics show cumulative count of Article Views (full-text article views including HTML views, PDF and ePub downloads, according to the available data) and Abstracts Views on Vision4Press platform.
Data correspond to usage on the plateform after 2015. The current usage metrics is available 48-96 hours after online publication and is updated daily on week days.
Initial download of the metrics may take a while.