Fig. 8.
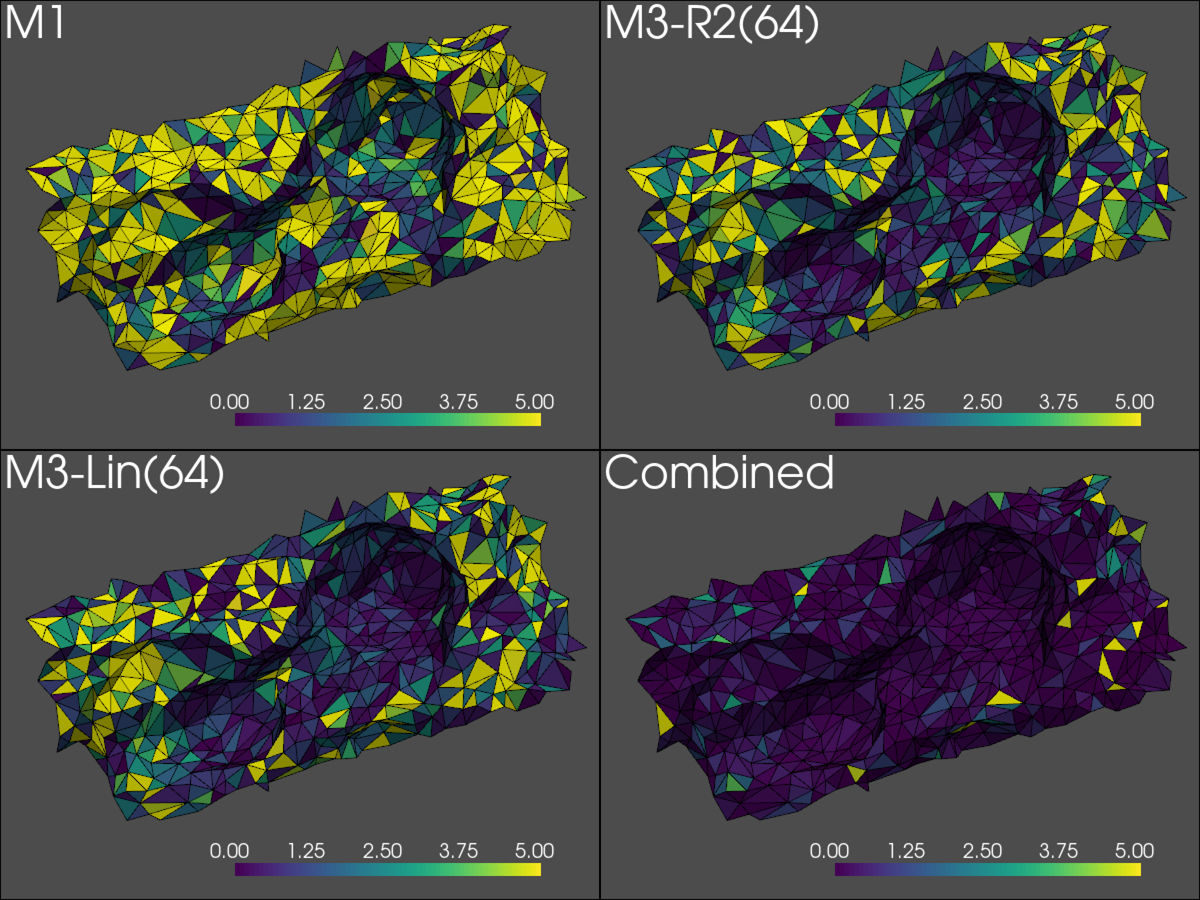
Inter-comparison of the various methods of estimating the view factors for a 1000 facet segment dominated by a large pit. In each of the four panels the color scale represents absolute value percent differences in total view factor of a facet with respect to the M4 method. The limits on the color scale are 0–5%, and facets above this limit are shown in yellow. This includes a couple of facets at the edges of the extracted surface that do not have the visibility of any other facets. The labels in each panel indicate a particular method to which the results belong. The numbers in parentheses indicate the number of sub-facets for the M3 methods, for example, M3-Lin(64) means that M3-Linear with each facet split into 64 sub-facets. A comparison of the “combined” method aimed to optimize speed and accuracy is presented in the bottom right panel, which is detailed in Appendix B.
Current usage metrics show cumulative count of Article Views (full-text article views including HTML views, PDF and ePub downloads, according to the available data) and Abstracts Views on Vision4Press platform.
Data correspond to usage on the plateform after 2015. The current usage metrics is available 48-96 hours after online publication and is updated daily on week days.
Initial download of the metrics may take a while.