Fig. 3.
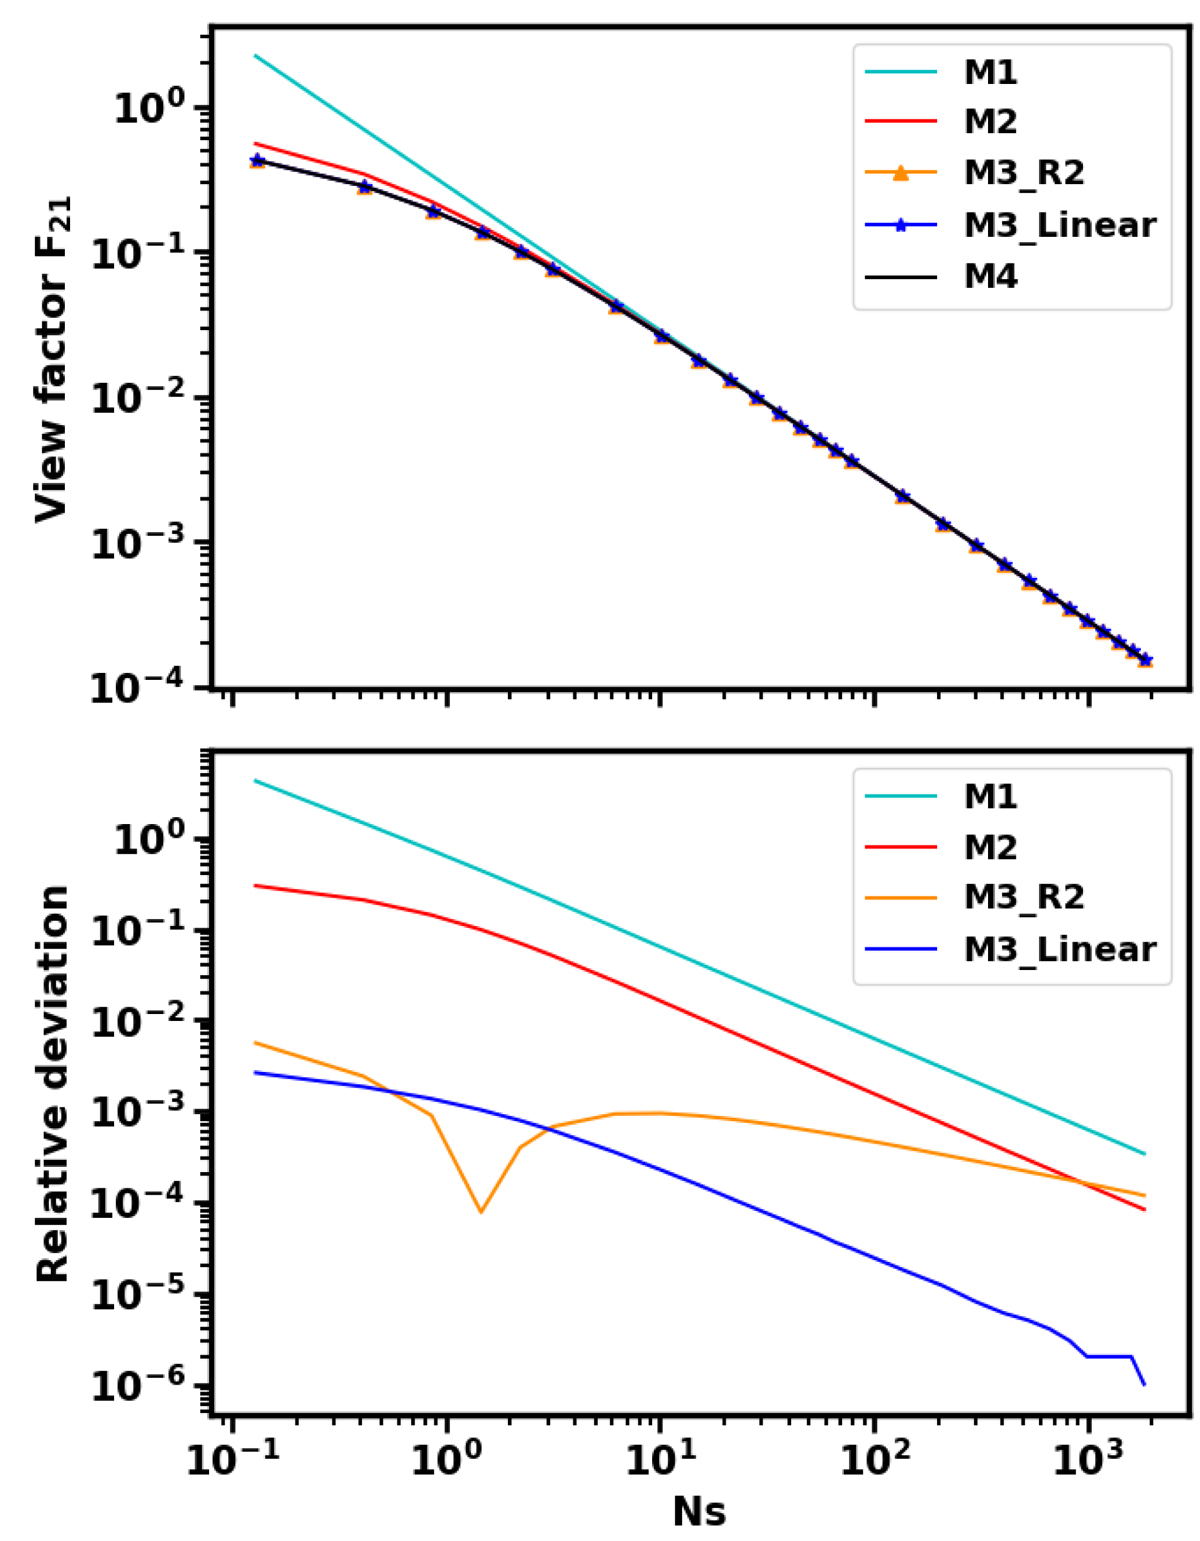
Top: comparison of multiple methods for calculating the view factor F21 for two parallel facets (the case A) in Fig. 2) as a function of Ns (Eq. (9)). Bottom: relative deviation from M4 as a function of Ns for different methods. The standard approach, M1, is accurate to within 1% when Ns is larger than about 100, while the subdivision methods, M3-Linear and M3-R2, are in accurate within 1% for the entire range of Ns. Therefore, these methods are clearly superior to the M1 and M2 methods.
Current usage metrics show cumulative count of Article Views (full-text article views including HTML views, PDF and ePub downloads, according to the available data) and Abstracts Views on Vision4Press platform.
Data correspond to usage on the plateform after 2015. The current usage metrics is available 48-96 hours after online publication and is updated daily on week days.
Initial download of the metrics may take a while.