Fig. 9.
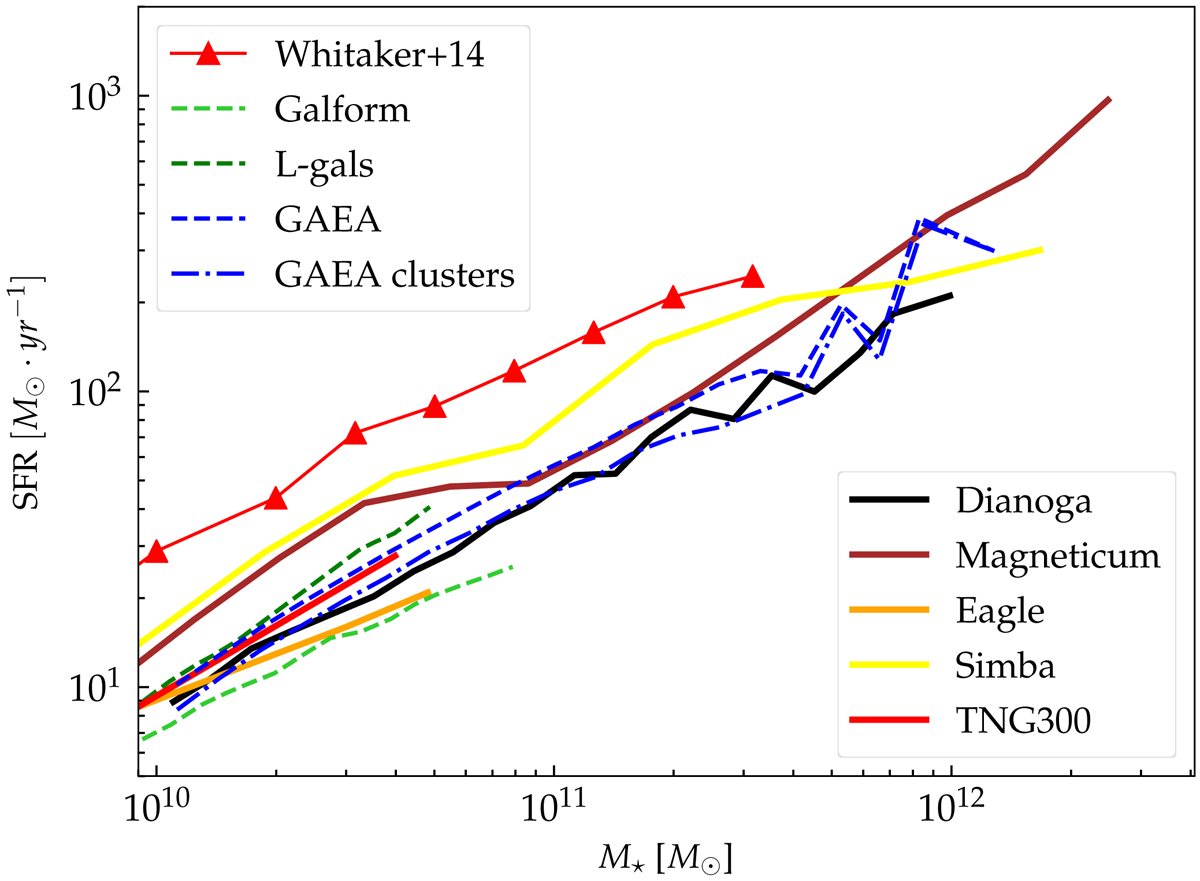
Main sequence of star forming galaxies at z ∼ 2. Red triangles are observational data from Whitaker et al. (2014). The black line shows median values for our simulations. Coloured solid and dashed lines are data from other cosmological simulations and semi-analytical models respectively. In particular: Eagle (orange solid line, Guo et al. 2016), TNG300 (red solid line, Donnari et al. 2019), Simba (yellow solid line, Davé et al. 2019), Galform (green dashed line, Guo et al. 2016), L-galaxies (dark green dashed line, Guo et al. 2016), and GAEA (blue dashed line, Hirschmann et al. 2016). For the GAEA model we also show the results obtained considering only galaxies that at z = 0 are within galaxy clusters with mass > 1014.25 M⊙ (see text for more details).
Current usage metrics show cumulative count of Article Views (full-text article views including HTML views, PDF and ePub downloads, according to the available data) and Abstracts Views on Vision4Press platform.
Data correspond to usage on the plateform after 2015. The current usage metrics is available 48-96 hours after online publication and is updated daily on week days.
Initial download of the metrics may take a while.