Fig. 8.
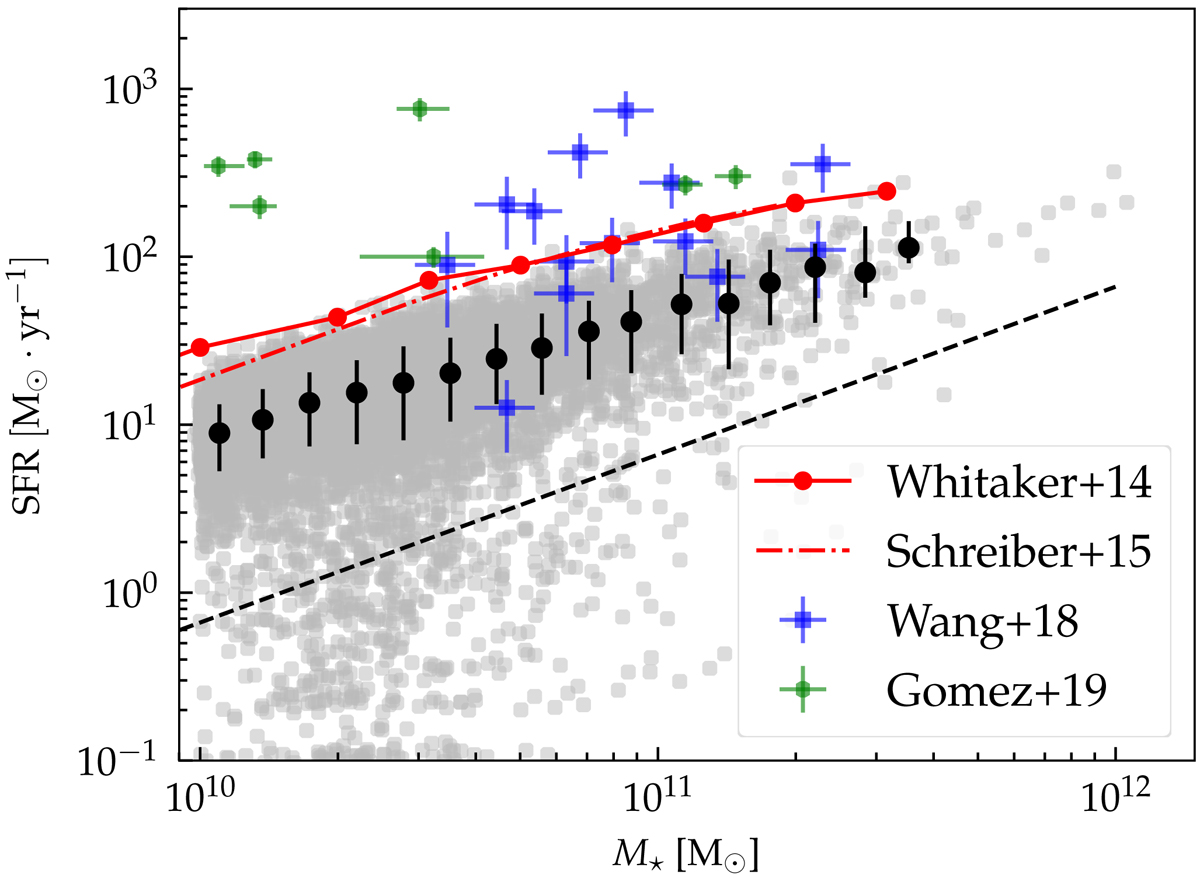
Star formation rate as a function of galaxy stellar mass at z ∼ 2.3. Red solid and dashed lines are observational data from Whitaker et al. (2014) and Schreiber et al. (2015), respectively. Green hexagons and blue squares are galaxies from the protoclusters of Gómez-Guijarro et al. (2019) and the cluster of Wang et al. (2018), respectively. Grey points are galaxies in our simulations. Black dashed line fix the distinction between active and passive galaxies (Pacifici et al. 2016). Black points represent median values of star forming galaxies with 16th and 84th percentiles. Both SFRs and stellar masses are computed considering a 3D aperture of 30 pkpc.
Current usage metrics show cumulative count of Article Views (full-text article views including HTML views, PDF and ePub downloads, according to the available data) and Abstracts Views on Vision4Press platform.
Data correspond to usage on the plateform after 2015. The current usage metrics is available 48-96 hours after online publication and is updated daily on week days.
Initial download of the metrics may take a while.