Fig. 7.
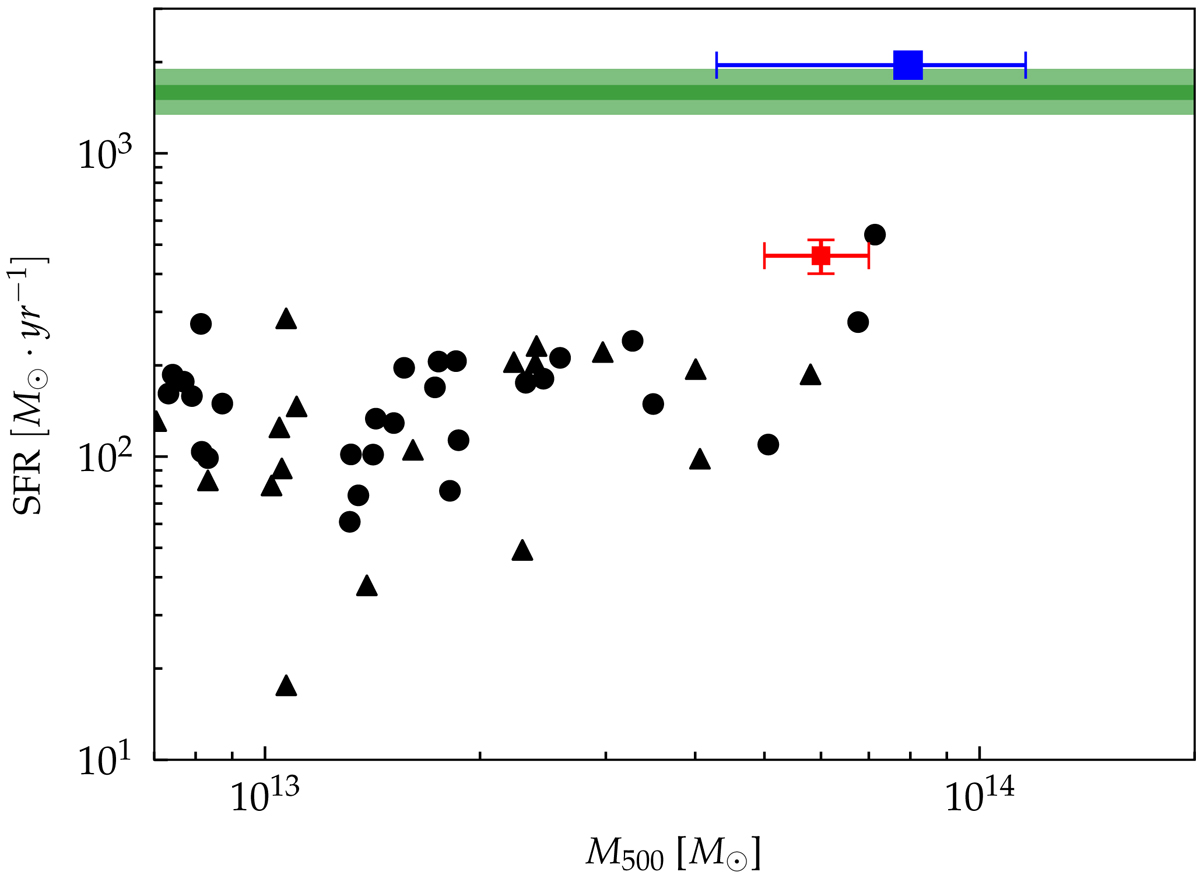
Star formation rate of protocluster regions at 2 < z < 2.6 in observations and simulations within an aperture of ∼100 pkpc. Green bands refer to two protoclusters from Gómez-Guijarro et al. (2019), the blue square refers to Wang et al. (2016), and the red square refers to Coogan et al. (2018). Black circles and triangles refer to numerical simulations, where the SFR is plotted against protocluster core mass. We used black circles for groups which end up in the central cluster of the region at z = 0, and black triangles otherwise.
Current usage metrics show cumulative count of Article Views (full-text article views including HTML views, PDF and ePub downloads, according to the available data) and Abstracts Views on Vision4Press platform.
Data correspond to usage on the plateform after 2015. The current usage metrics is available 48-96 hours after online publication and is updated daily on week days.
Initial download of the metrics may take a while.