Fig. 6.
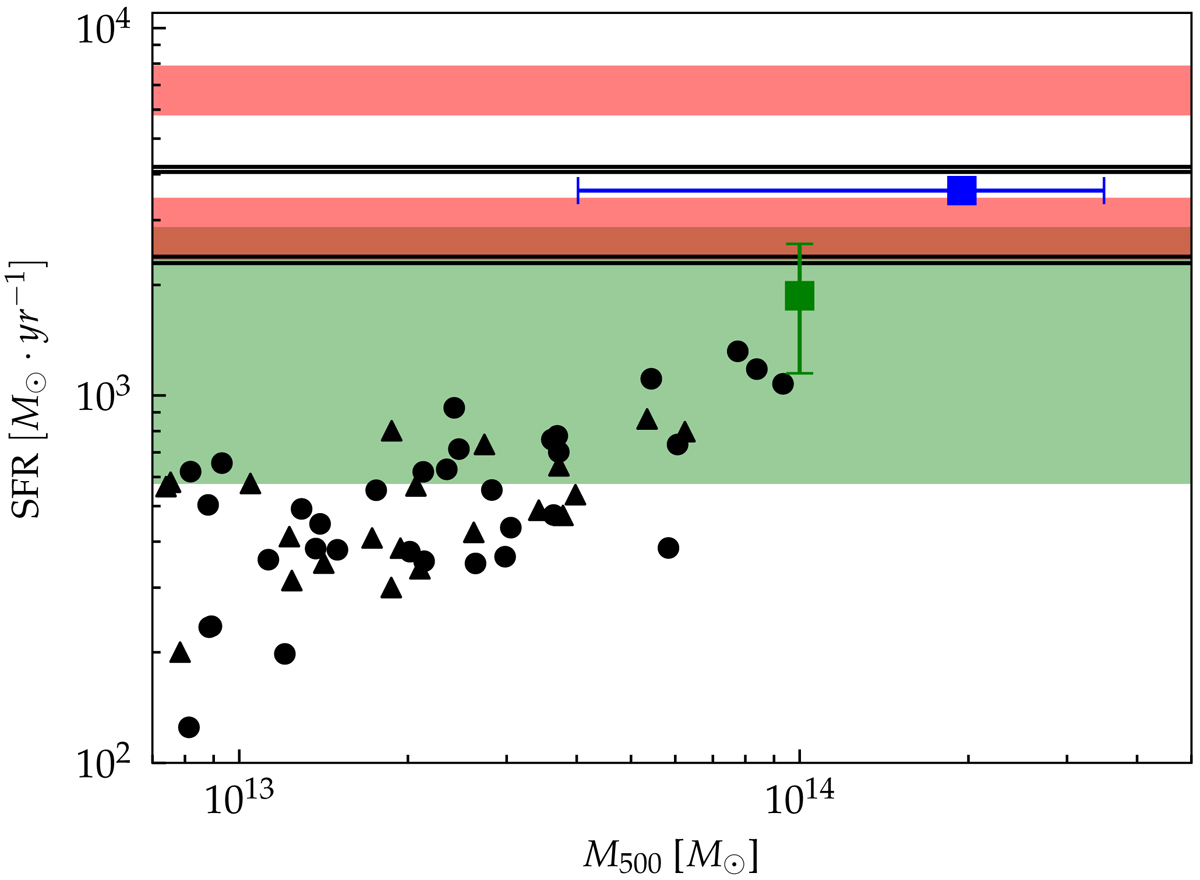
Star formation rate of protocluster regions at z ∼ 2 in observations and simulations within an aperture of ∼2 pMpc. Red bands refer to two clumps from Clements et al. (2014), black solid lines refer to four fields from Stevens et al. (2010) and analysed by Clements et al. (2014). The blue square highlights to the Spiderweb structure (Dannerbauer et al. 2014). The green square and green band show the two protoclusters analysed by Kato et al. (2016) (HS1700 and 2QZCluster, respectively). Black circles and triangles refer to numerical simulations, where the SFR is plotted against protocluster mass (see text). We used black circles for groups which end up in the central cluster of the region at z = 0, and black triangles otherwise.
Current usage metrics show cumulative count of Article Views (full-text article views including HTML views, PDF and ePub downloads, according to the available data) and Abstracts Views on Vision4Press platform.
Data correspond to usage on the plateform after 2015. The current usage metrics is available 48-96 hours after online publication and is updated daily on week days.
Initial download of the metrics may take a while.