Fig. 4.
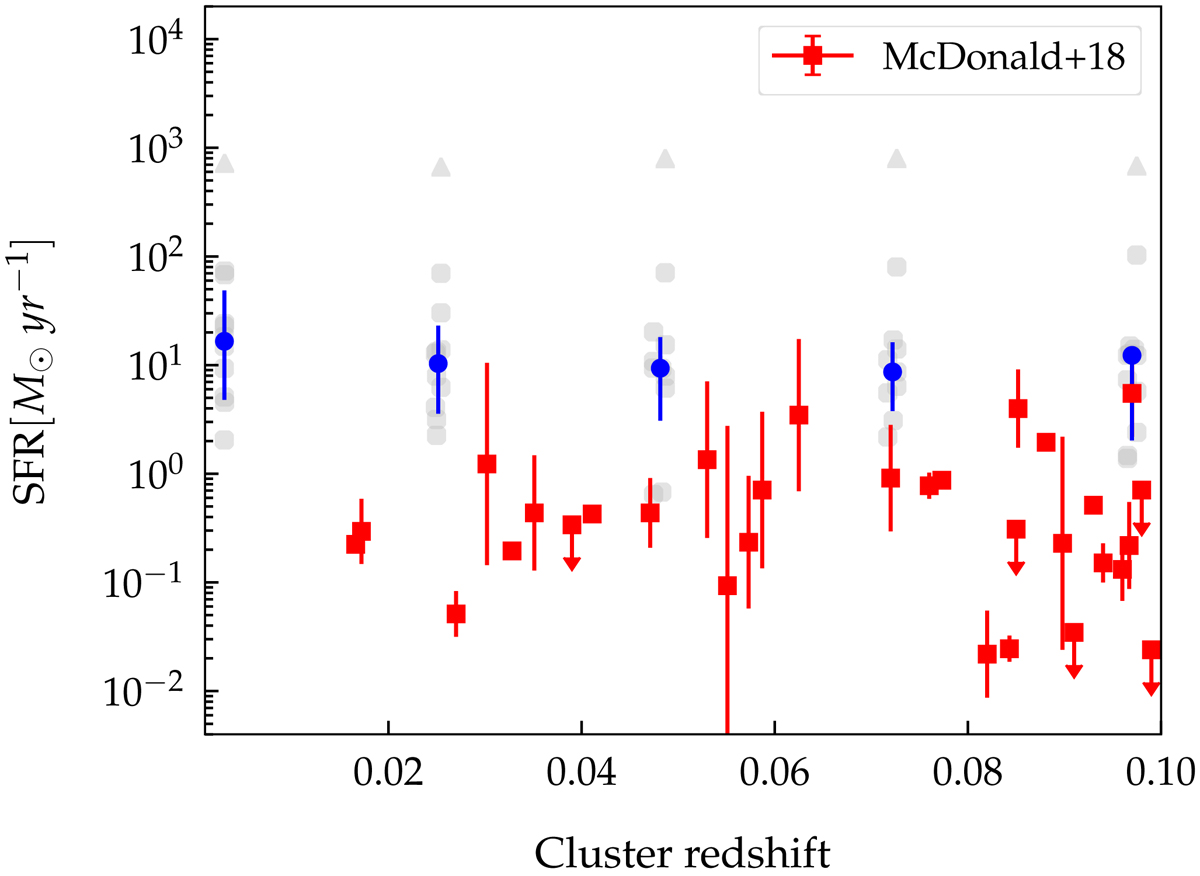
Star formation rate of BCGs in observations and simulations. Grey circles are BCGs of our simulations from different snapshots, while the grey triangle represents the BCG that lost its central BH at z ∼ 4 (see Sect. 2.3.1). BCGs from the same snapshot are shifted only for visualisation purposes. The median values are shown as blue circles and the vertical bars indicate the range between the 16th and 84th percentiles. A 2D aperture of 30 pkpc is used. Red squares are BCGs from the sample of McDonald et al. (2018) (see text for more details).
Current usage metrics show cumulative count of Article Views (full-text article views including HTML views, PDF and ePub downloads, according to the available data) and Abstracts Views on Vision4Press platform.
Data correspond to usage on the plateform after 2015. The current usage metrics is available 48-96 hours after online publication and is updated daily on week days.
Initial download of the metrics may take a while.