Fig. 3.
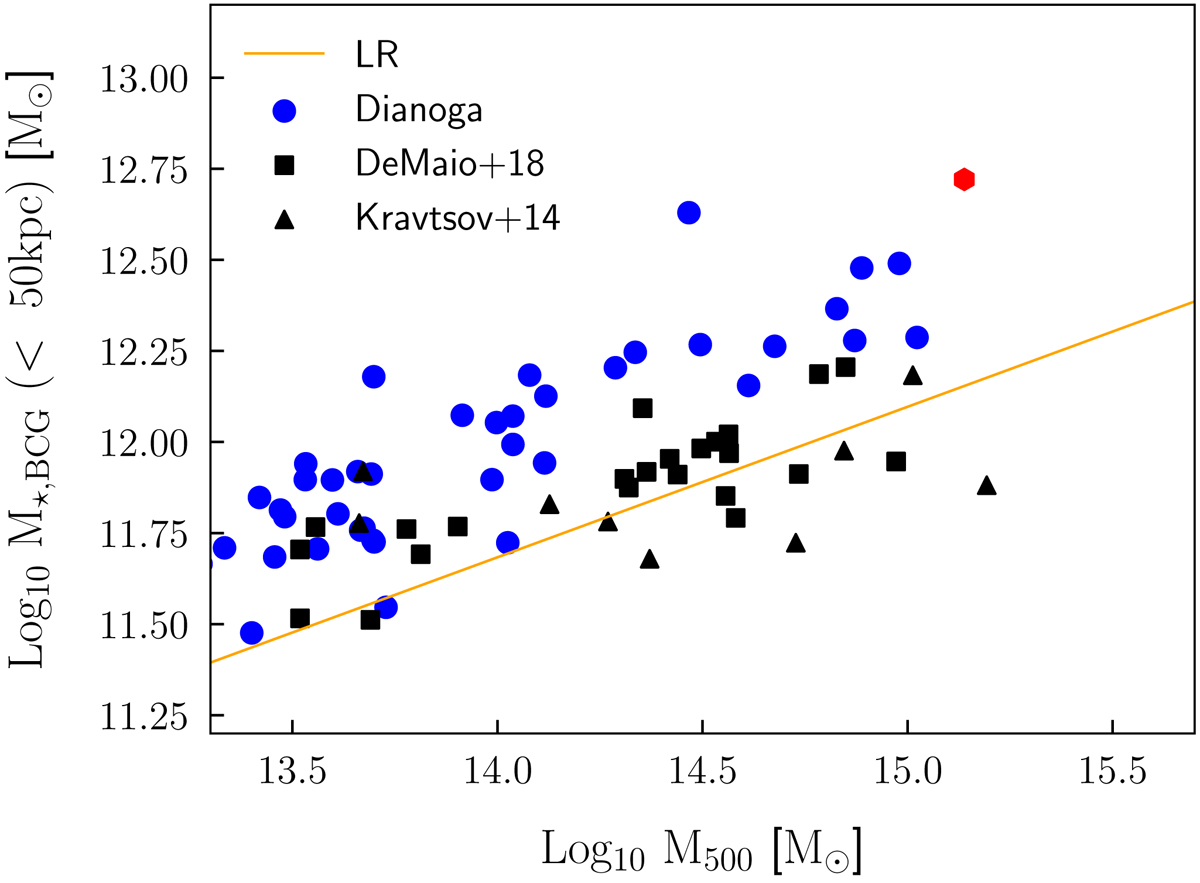
Correlation between BCG stellar mass and M500 at z = 0. Observations are taken from DeMaio et al. (2018) (blacks quares) and Kravtsov et al. (2018) (black triangles). The simulated values are shown as blue points. The red hexagon refers to the BCG that lost its central BH (see Sect. 2.3.1). The orange line is the fit to LR simulations (Ragone-Figueroa et al. 2018). BCG masses are obtained summing over all stellar particles bound to the main subhalo of a group or cluster by Subfind (BCG+ICL) and within a 2D aperture of 50 pkpc.
Current usage metrics show cumulative count of Article Views (full-text article views including HTML views, PDF and ePub downloads, according to the available data) and Abstracts Views on Vision4Press platform.
Data correspond to usage on the plateform after 2015. The current usage metrics is available 48-96 hours after online publication and is updated daily on week days.
Initial download of the metrics may take a while.