Fig. 2.
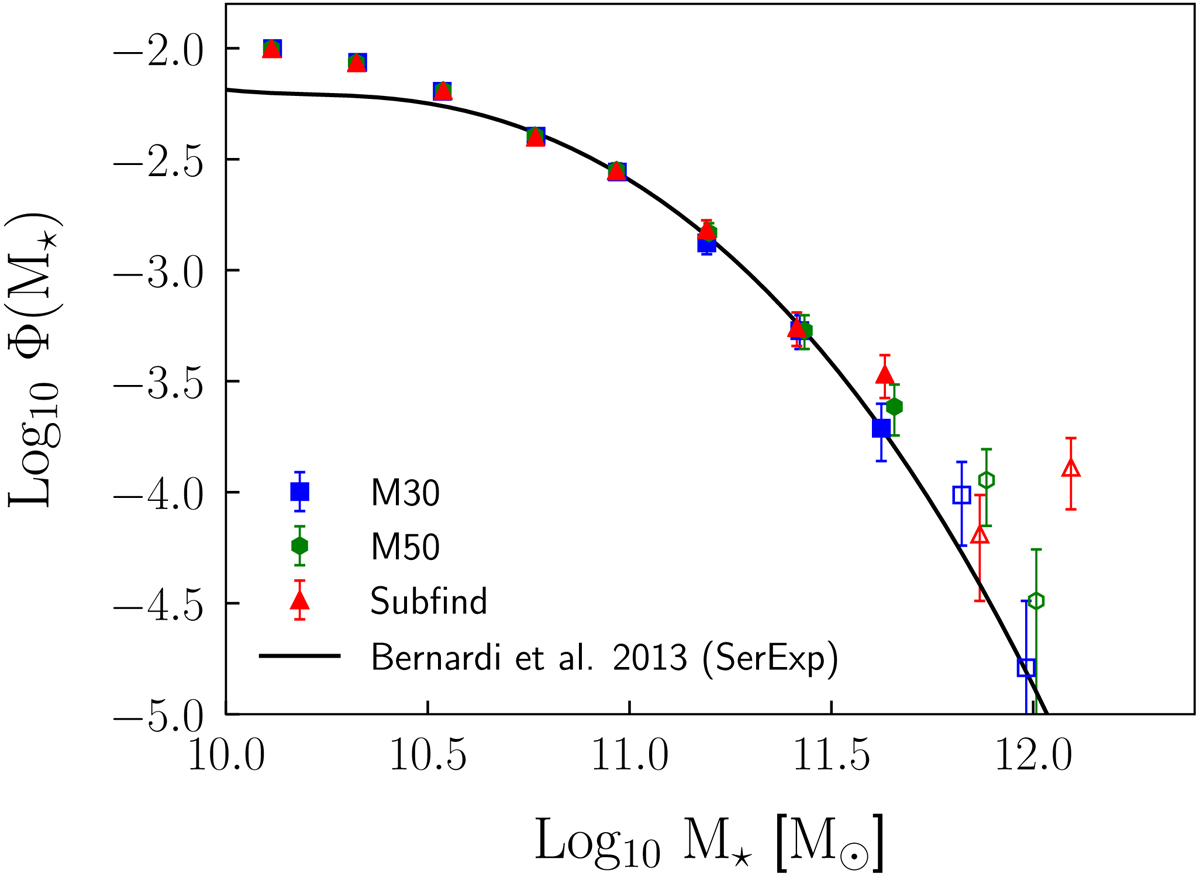
GSMF at z = 0. Observational data are taken from Bernardi et al. (2013) (black solid line). Simulation data are derived considering as stellar mass the sum of all stellar particles bound to the galaxy by Subfind (red triangles), and the same sum restricted to particles within 50 pkpc (green hexagon) and 30 pkpc (blue squares). Error bars are computed assuming Poissonian errors. The simulated GSMF is normalised following Eq. (8). Filled and empty marks represent the mass bins with respectively more than and less than ten galaxies.
Current usage metrics show cumulative count of Article Views (full-text article views including HTML views, PDF and ePub downloads, according to the available data) and Abstracts Views on Vision4Press platform.
Data correspond to usage on the plateform after 2015. The current usage metrics is available 48-96 hours after online publication and is updated daily on week days.
Initial download of the metrics may take a while.