Fig. 14.
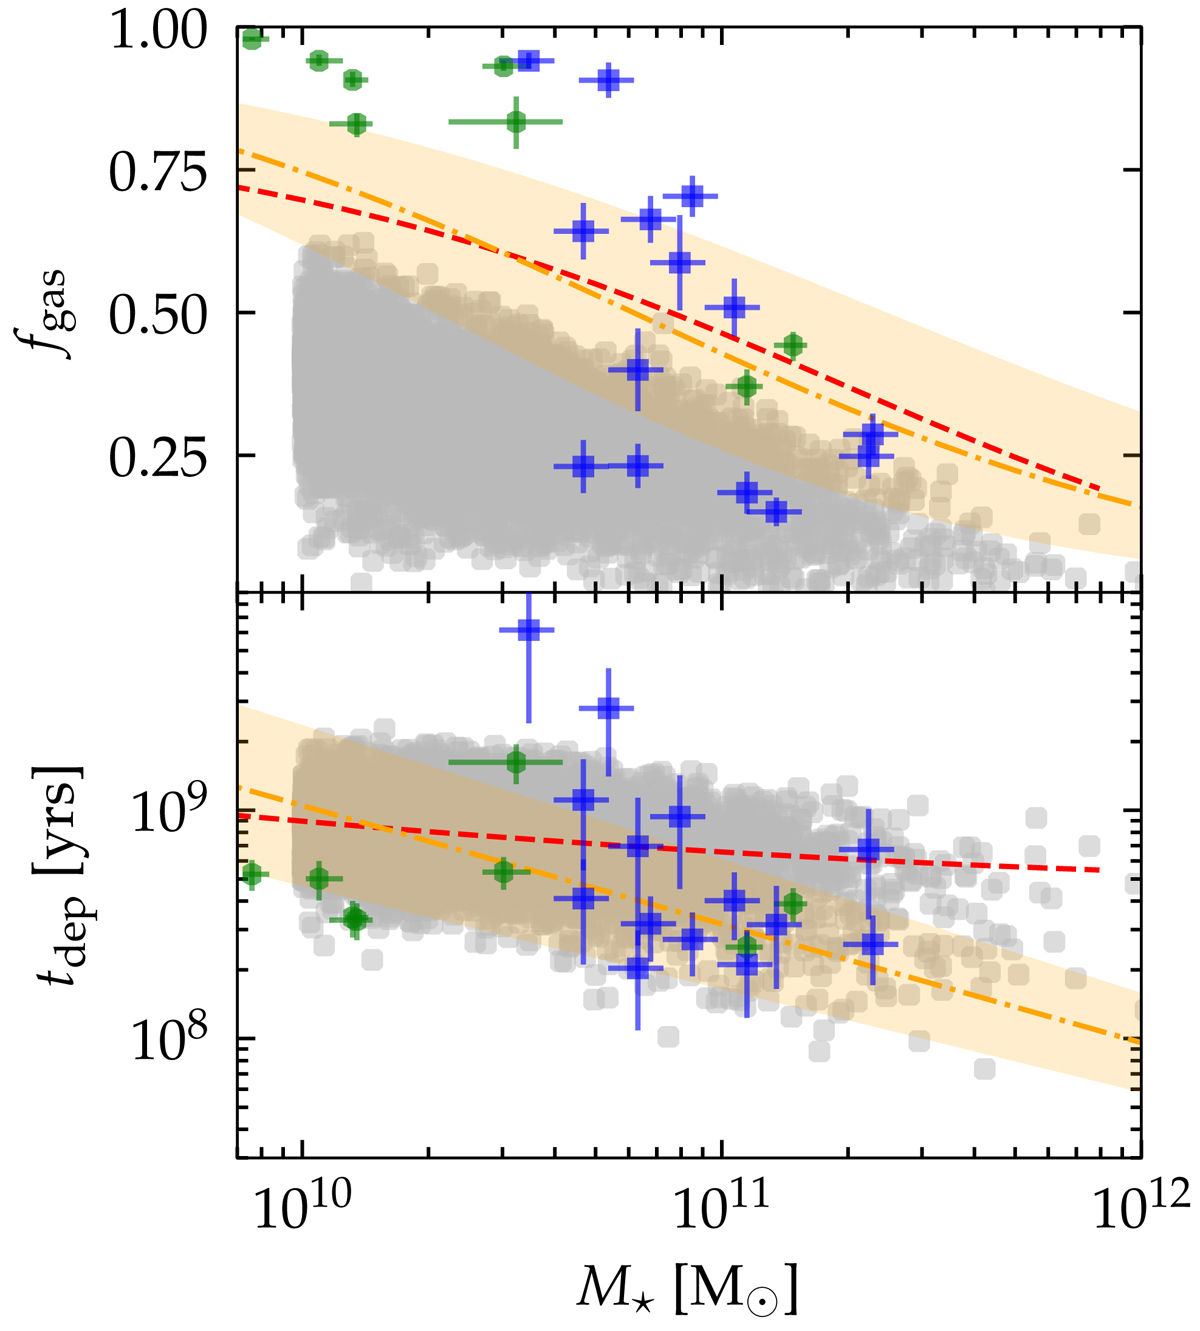
Galaxy correlations at z = 2.3. Top panel: gas fraction as a function of stellar mass. Bottom panel: depletion time as a function of stellar mass. Grey circles refer to Dianoga simulations at z = 2.3. Green hexagons and blue squares are data from Gómez-Guijarro et al. (2019) and Wang et al. (2018) respectively. The orange dashed line is the functional form of Liu et al. (2019) for MS galaxies at z = 2.3, while the shaded region encompasses galaxies with an SFR that is four times lower and higher than MS galaxies. Red dashed lines are obtained combining the MS by Whitaker et al. (2014) and the integrated Kennicutt-Schmidt law from Sargent et al. (2014, orange line in the plot).
Current usage metrics show cumulative count of Article Views (full-text article views including HTML views, PDF and ePub downloads, according to the available data) and Abstracts Views on Vision4Press platform.
Data correspond to usage on the plateform after 2015. The current usage metrics is available 48-96 hours after online publication and is updated daily on week days.
Initial download of the metrics may take a while.