Fig. 12.
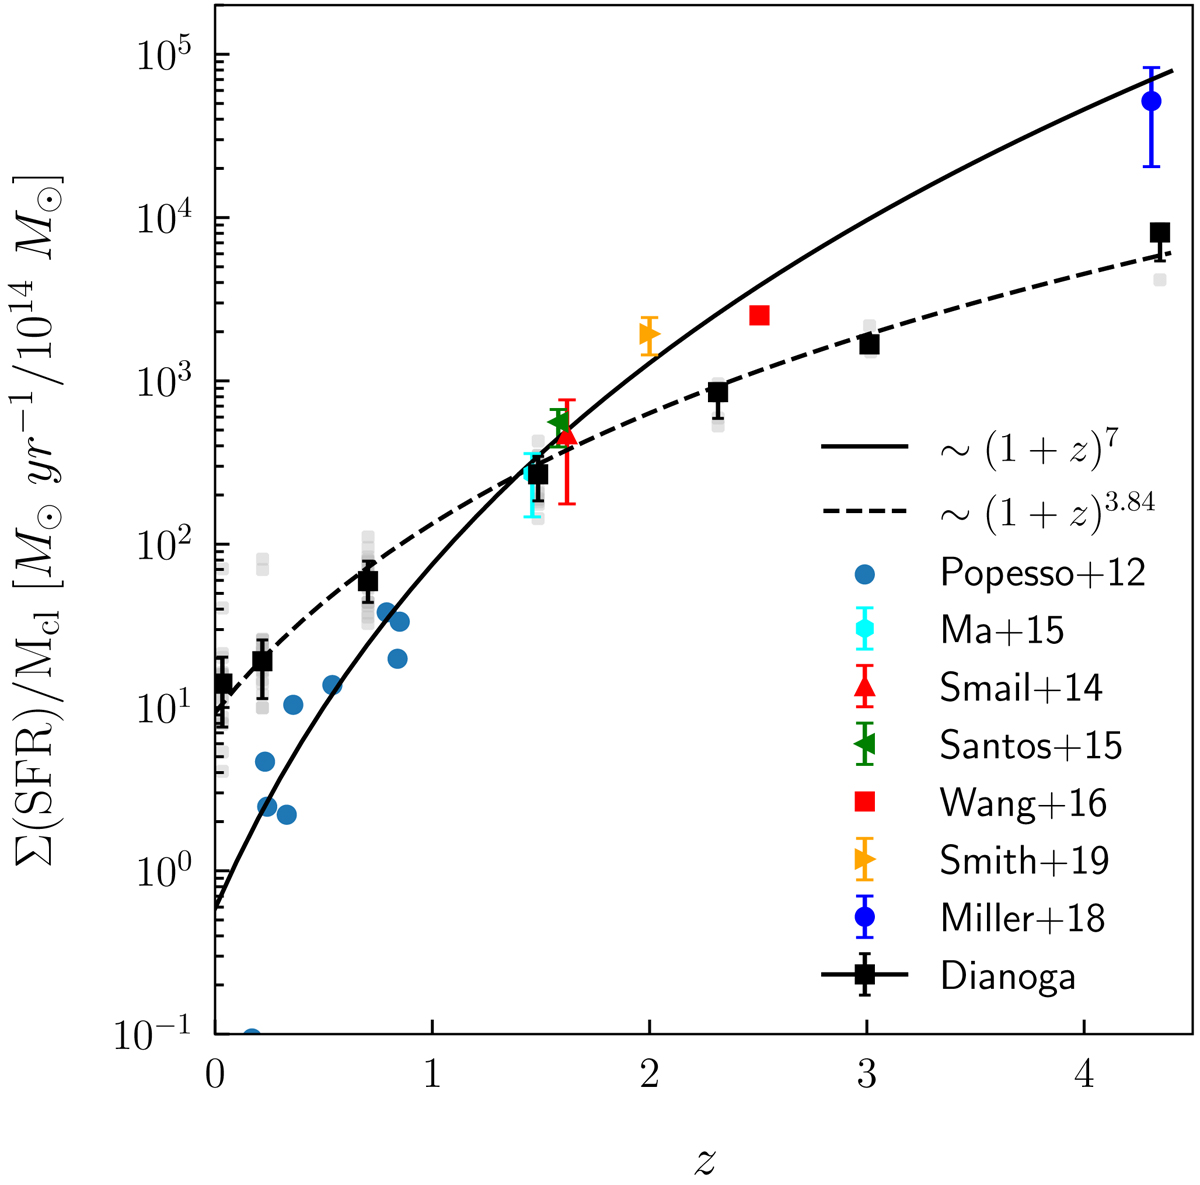
Star formation rate normalised by cluster mass as a function of redshift. Black squares represent median values from Dianoga simulations (grey points). See the text for a complete explanation of sample selection. The dashed black line is the best fit to simulations. Coloured points are observational data from Popesso et al. (2012), Ma et al. (2015), Smail et al. (2014), Santos et al. (2015), Wang et al. (2016), Miller et al. (2018), and Smith et al. (2019). The solid black line ∼(1 + z)7 shows an empirical fit to data suggested by Cowie et al. (2004) and Geach et al. (2006).
Current usage metrics show cumulative count of Article Views (full-text article views including HTML views, PDF and ePub downloads, according to the available data) and Abstracts Views on Vision4Press platform.
Data correspond to usage on the plateform after 2015. The current usage metrics is available 48-96 hours after online publication and is updated daily on week days.
Initial download of the metrics may take a while.