Fig. 11.
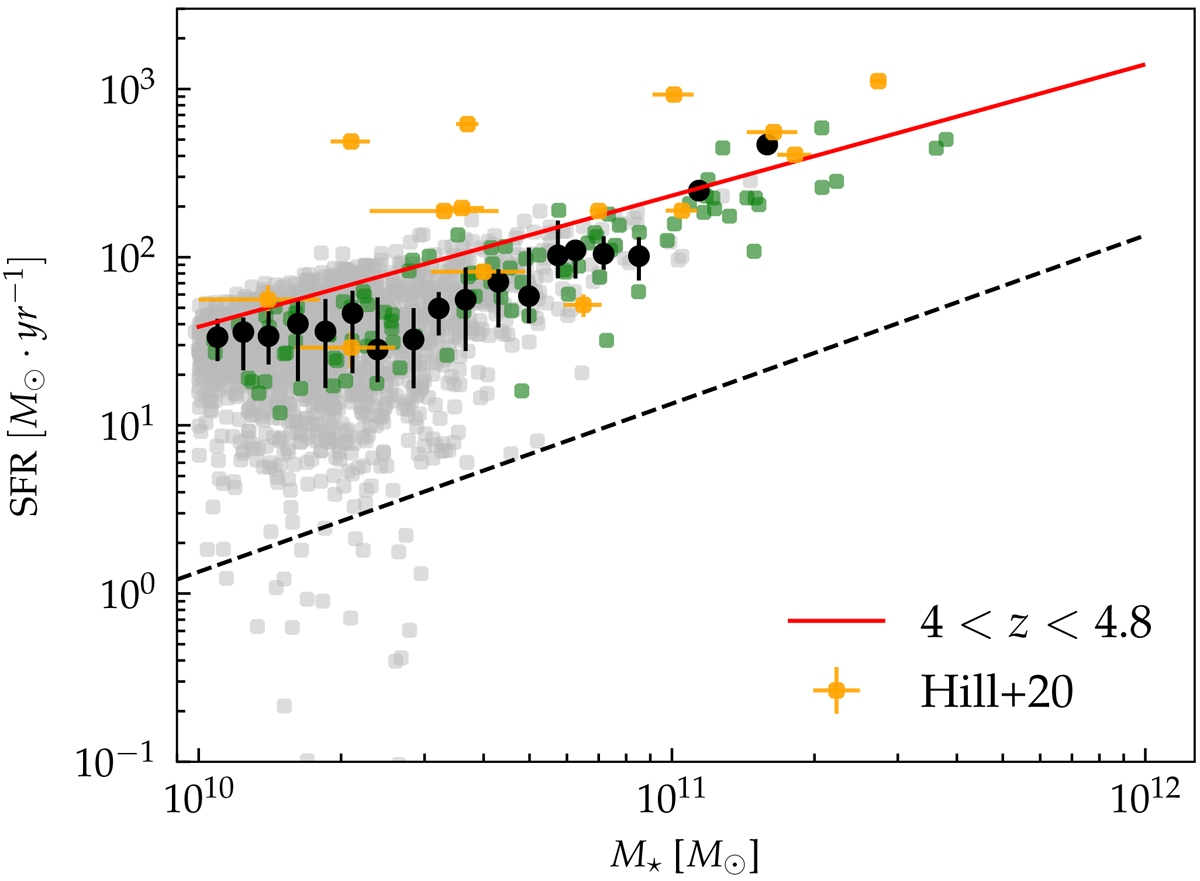
Star formation rate as a function of galaxy stellar mass at z ∼ 4.3. The red line shows observational data from Steinhardt et al. (2014). Orange dots represent galaxies of SPT2349-56 as analysed in Hill et al. (2020). Grey points are galaxies in our simulations. The black dashed line fixes the distinction between quiescent and star forming galaxies (Pacifici et al. 2016). Black points represent median values with 16th and 84th percentiles for star forming galaxies. Green circles are galaxies from the simulated protoclusters shown in Fig. 10.
Current usage metrics show cumulative count of Article Views (full-text article views including HTML views, PDF and ePub downloads, according to the available data) and Abstracts Views on Vision4Press platform.
Data correspond to usage on the plateform after 2015. The current usage metrics is available 48-96 hours after online publication and is updated daily on week days.
Initial download of the metrics may take a while.