Fig. 10.
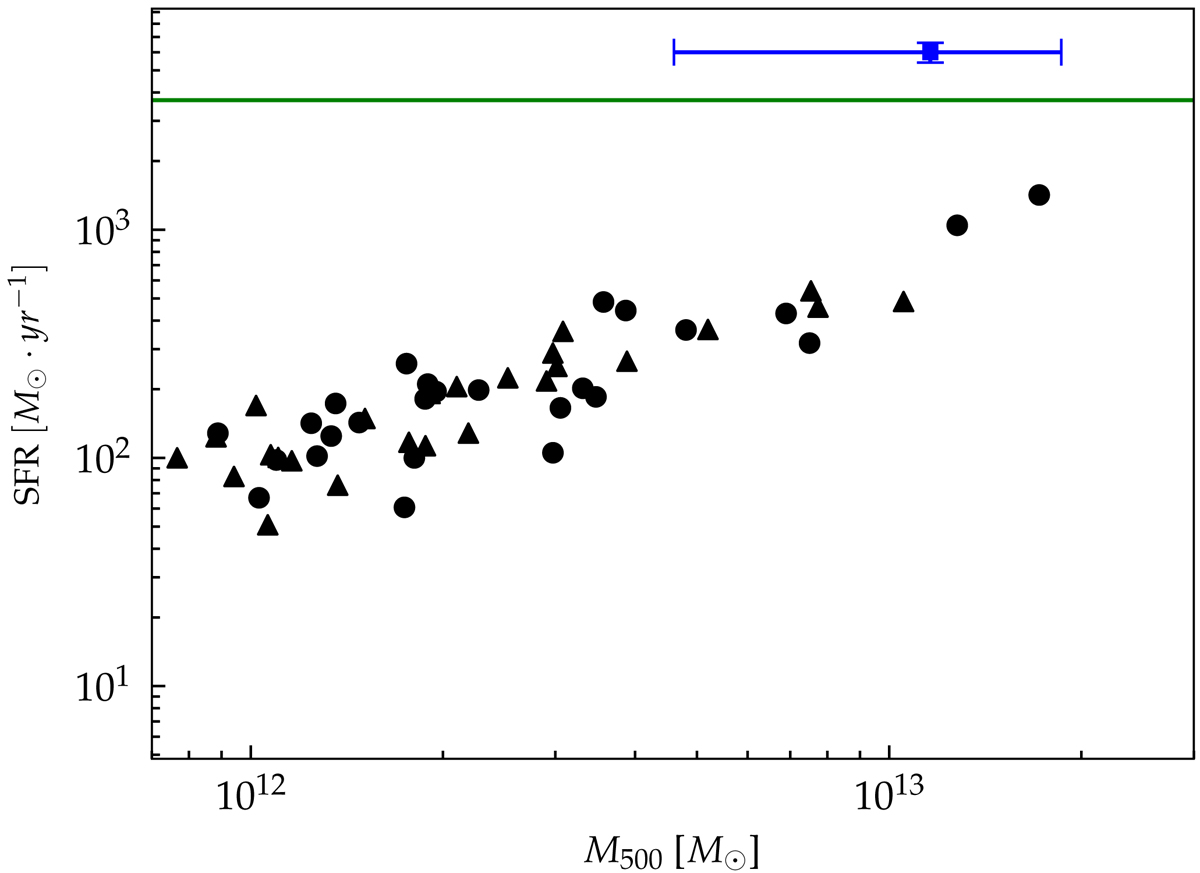
Star formation rate as a function of M500 at z ∼ 4.3. The blue square and green line are the observed values of Miller et al. (2018) and Oteo et al. (2018) protoclusters respectively. Black symbols refer to the SFR computed in a cylinder 1 pMpc long and within a circular aperture of 130 pkpc in our simulations. The five most massive groups of each region are shown. We used black circles for groups which end up in the central cluster of the region at z = 0, and black triangles otherwise.
Current usage metrics show cumulative count of Article Views (full-text article views including HTML views, PDF and ePub downloads, according to the available data) and Abstracts Views on Vision4Press platform.
Data correspond to usage on the plateform after 2015. The current usage metrics is available 48-96 hours after online publication and is updated daily on week days.
Initial download of the metrics may take a while.