Fig. 1.
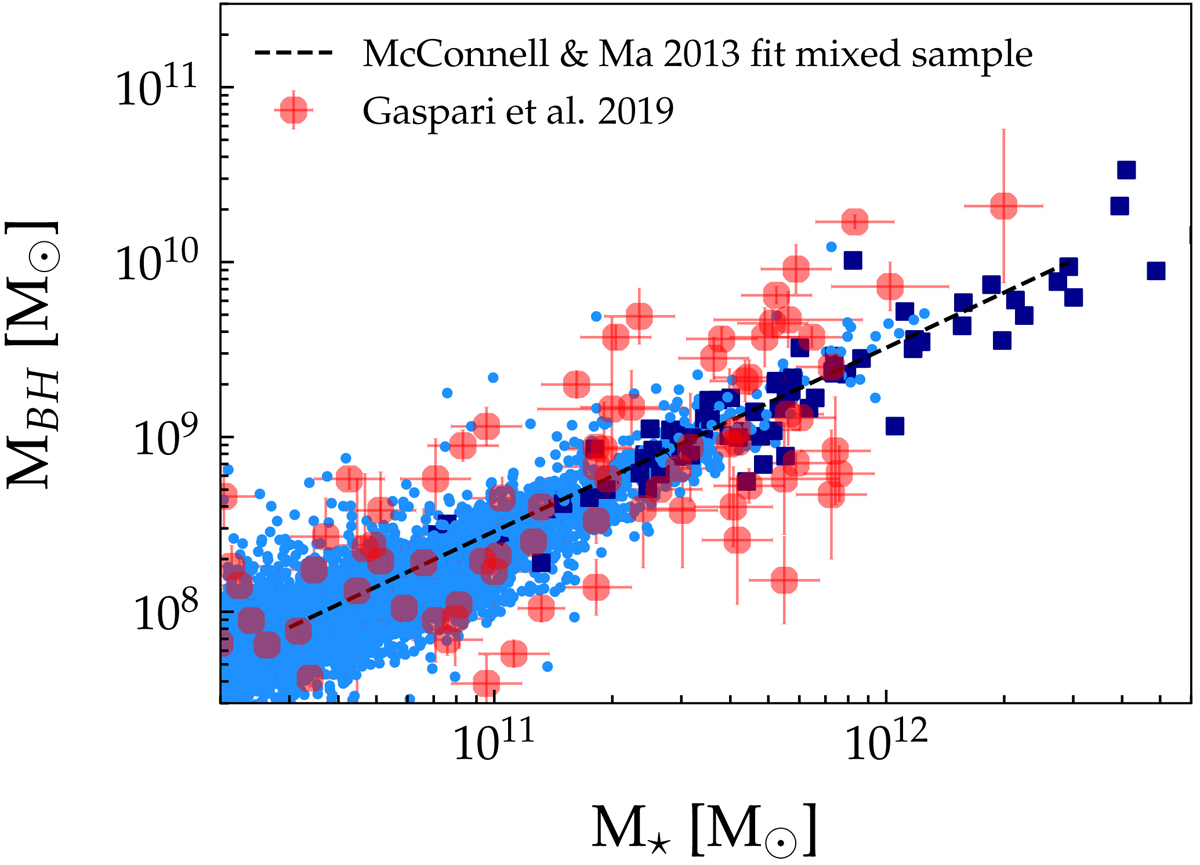
Correlation between the galaxies stellar mass and the central SMBHs mass. Observational data are taken from McConnell & Ma (2013) (dashed black line) and from Gaspari et al. (2019) (red circles). The simulated stellar masses for satellite galaxies (cyan points) are obtained considering the star particles bound to the substructure (accordingly to Subfind) and within 50 pkpc from its centre. The mass of the central galaxies (dark-blue squares) is obtained by summing over all stellar particles within an aperture of 0.15 × R500.
Current usage metrics show cumulative count of Article Views (full-text article views including HTML views, PDF and ePub downloads, according to the available data) and Abstracts Views on Vision4Press platform.
Data correspond to usage on the plateform after 2015. The current usage metrics is available 48-96 hours after online publication and is updated daily on week days.
Initial download of the metrics may take a while.