Fig. 3
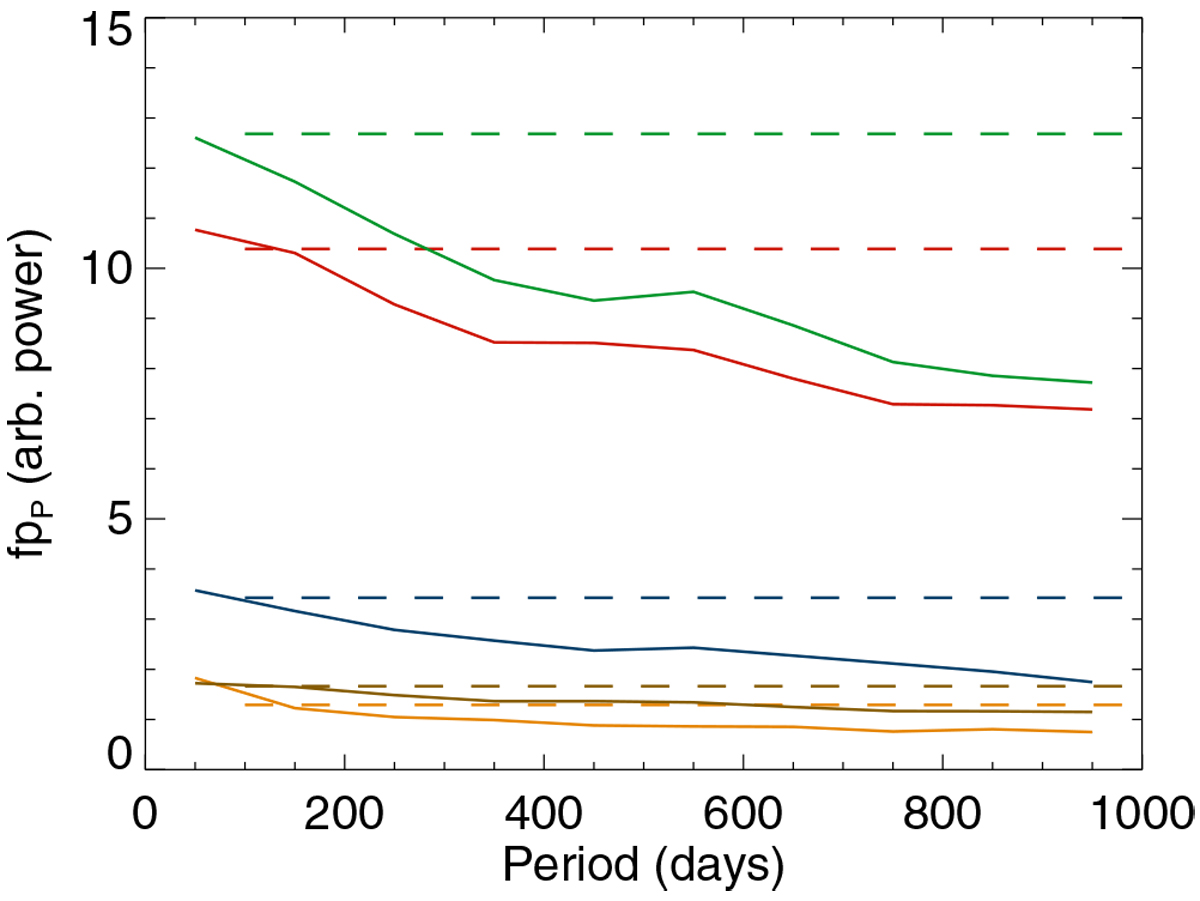
False positive level in power fpP vs. period for highest number of points, G2 stars, and five OGS configurations (GRAhigh in orange, SGmed in red, SGlow in brown, ALLGRAhigh,SGmed in green, andALLGRAhigh,SGlow in blue). Thesolid lines represent fpP computed in 100 days ranges, while the dashed horizontal lines correspond to the single value of fpP computed over 100–1000 days.
Current usage metrics show cumulative count of Article Views (full-text article views including HTML views, PDF and ePub downloads, according to the available data) and Abstracts Views on Vision4Press platform.
Data correspond to usage on the plateform after 2015. The current usage metrics is available 48-96 hours after online publication and is updated daily on week days.
Initial download of the metrics may take a while.