Fig. A.2
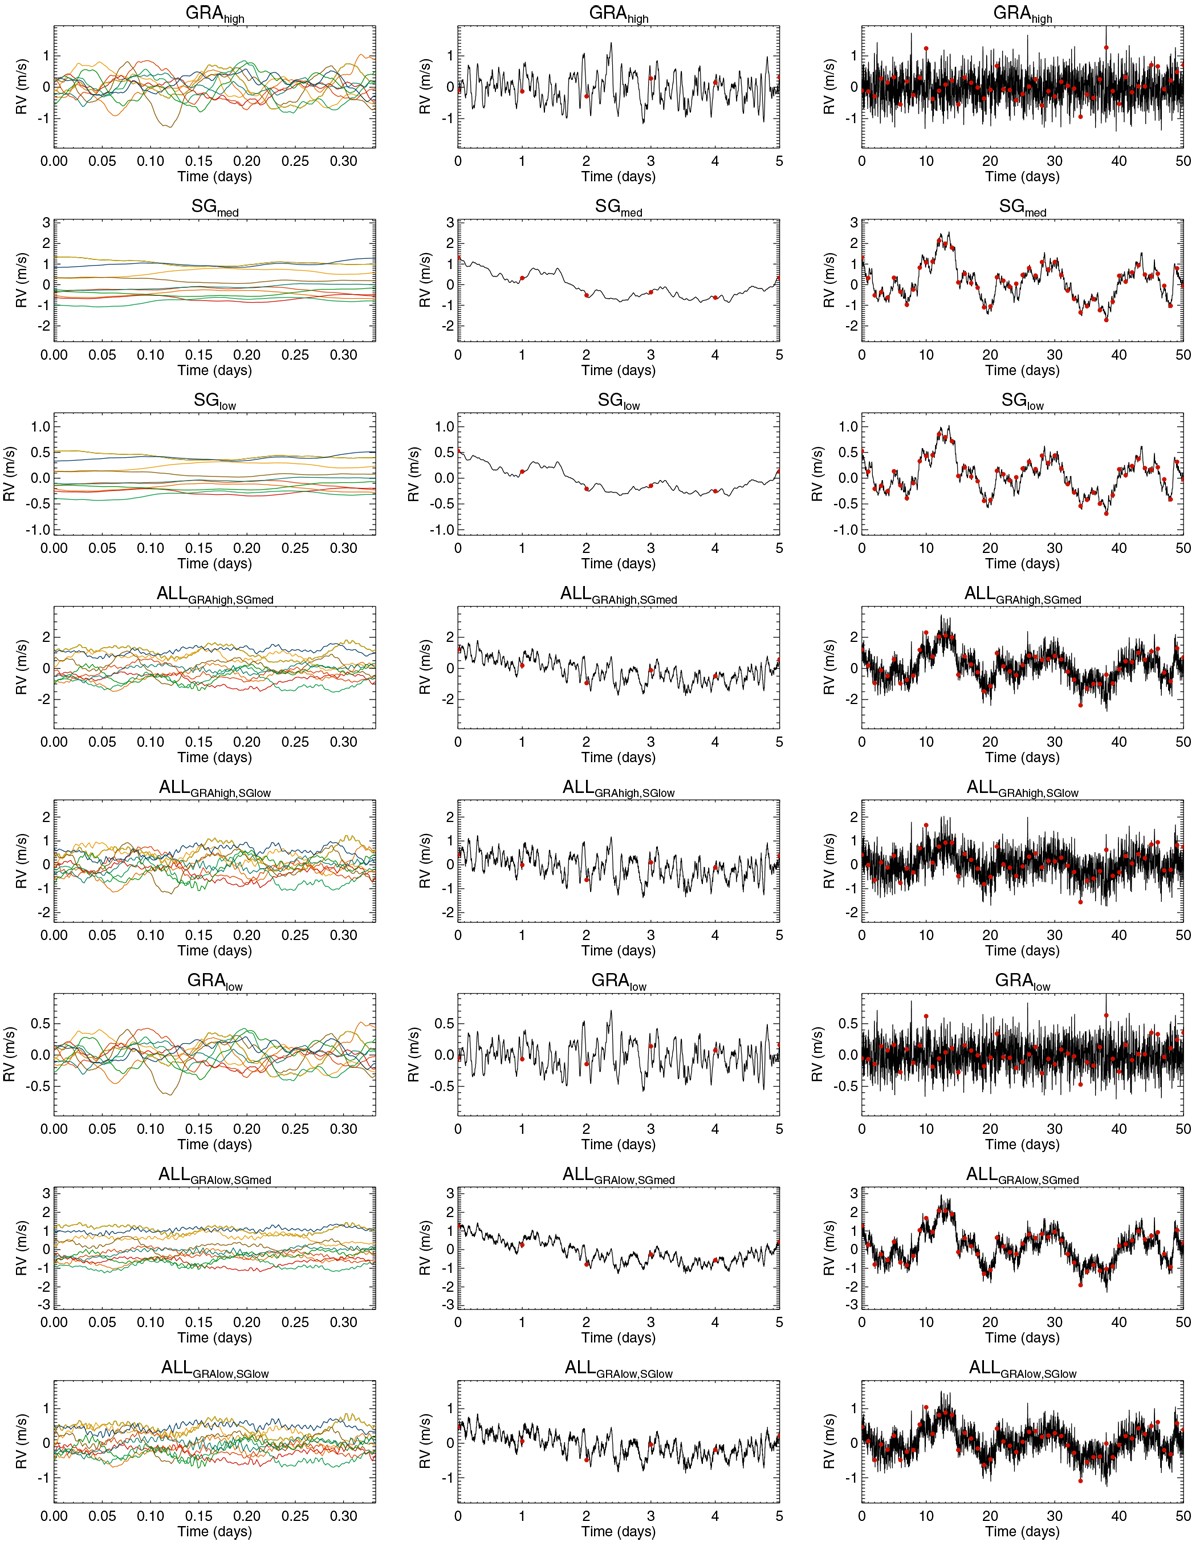
Extract from time series vs. time for F6 stars, different OGS configurations (from top to bottom) and for three temporal coverages: 8 h (left-hand side panels), 5 days (middle panels) and 50 days (right-hand side panels), smoothed over 1 h. For the 8-h coverage, ten examples corresponding to adjacent nights are superposed (each section of the RV time series is represented by a different color). For the two other coverage sets, the black line represents the full resolution time series (smoothed over 1 h) and the red circles are the selected points used in the analysis (one point per day).
Current usage metrics show cumulative count of Article Views (full-text article views including HTML views, PDF and ePub downloads, according to the available data) and Abstracts Views on Vision4Press platform.
Data correspond to usage on the plateform after 2015. The current usage metrics is available 48-96 hours after online publication and is updated daily on week days.
Initial download of the metrics may take a while.