Open Access
Fig. A.1
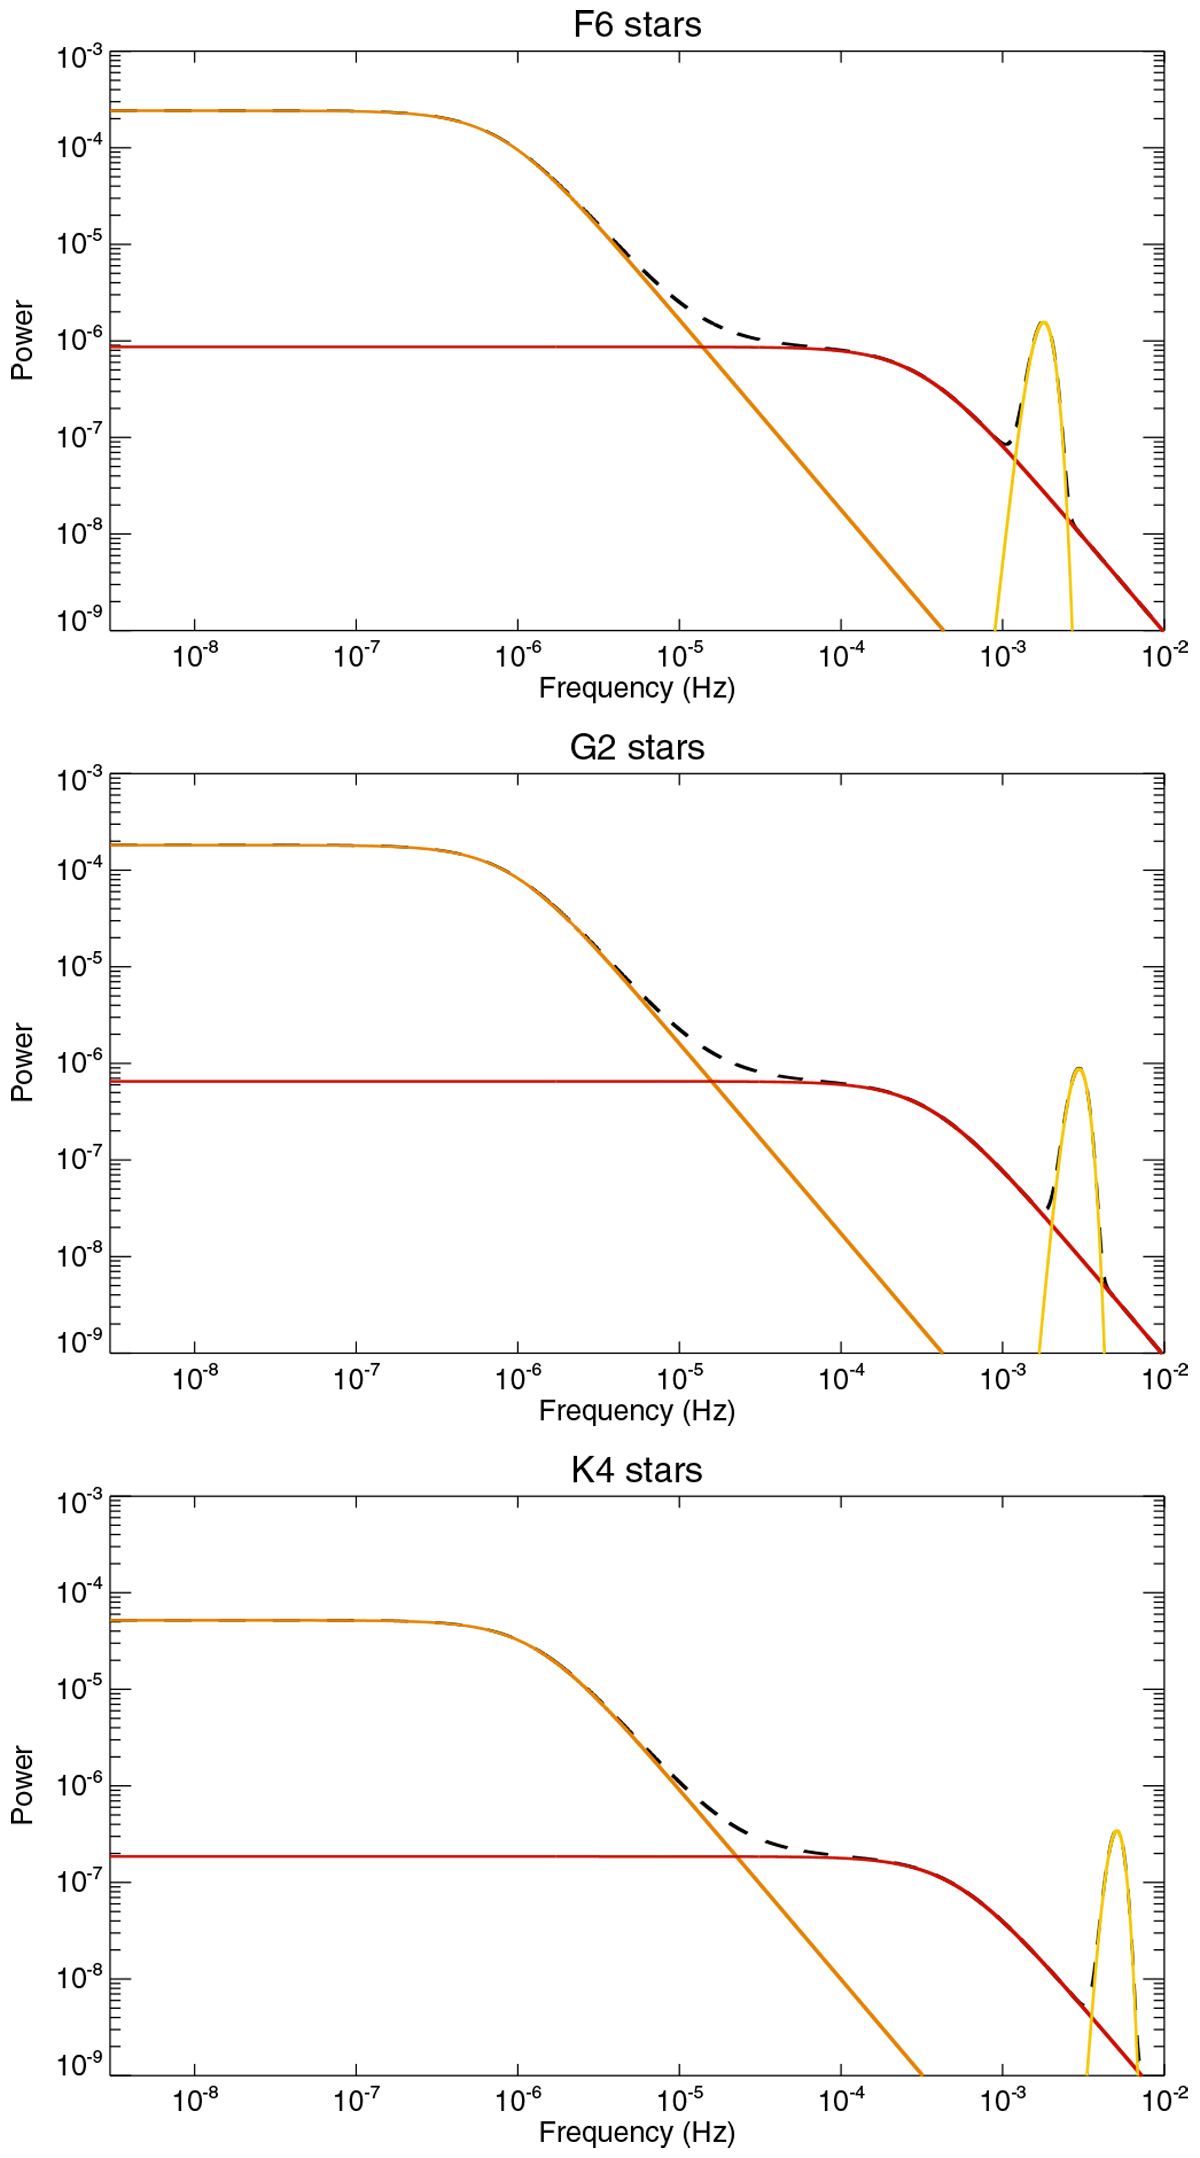
Example of power function used in Sect. 2.1, for F6, G2, and K4 stars (from top to bottom), for SGmed (red), for GRAhigh (orange), and oscillations (yellow). The dashed black line represents the sum of these three curves.
Current usage metrics show cumulative count of Article Views (full-text article views including HTML views, PDF and ePub downloads, according to the available data) and Abstracts Views on Vision4Press platform.
Data correspond to usage on the plateform after 2015. The current usage metrics is available 48-96 hours after online publication and is updated daily on week days.
Initial download of the metrics may take a while.