Fig. 21
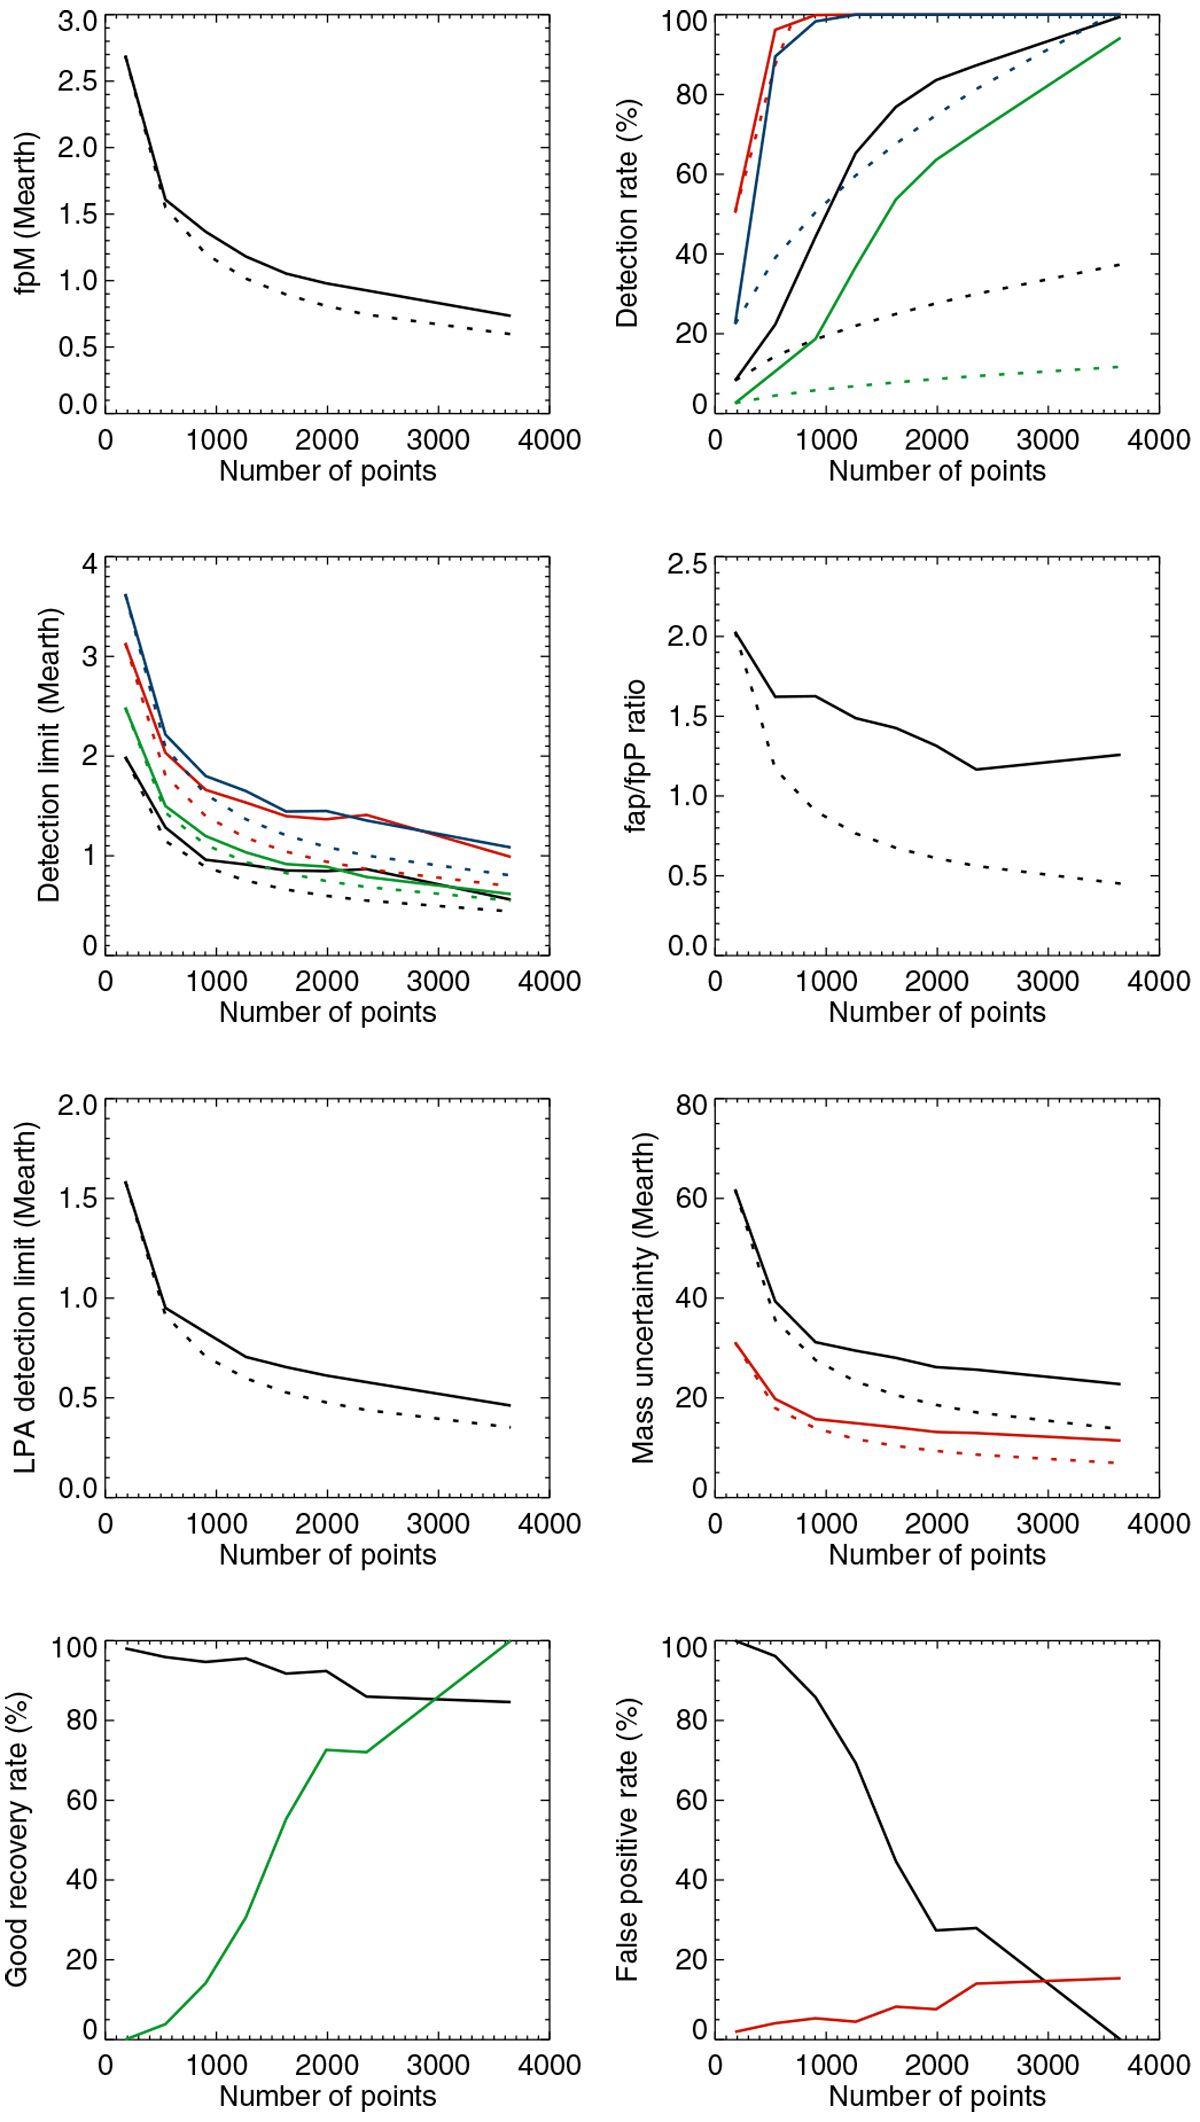
Effect of Nobs on performance studied in Sects. 2, 3, and 4 for G2 stars, PHZmed and ALLGRAhigh,SGlow. The different panels represent: fpM from Sect. 2.3; detection rates using the true false positive level in power (black line) and mass (red line) from Sect. 3.1; true detection limits in power (black line for 50% detection rate, red line for 95% detection rate) and in mass (green line for 50% detection rate, blue line for 95% detection rate) from Sect. 3.2; fap/fpP from Sect. 4.1; average LPA detection limit from Sect. 4.2; 1σ uncertainty on the mass characterisation from Sect. 4.3 (black for 1 MEarth and red for 2 MEarth); detection rate from the blind test in Sect. 4.4 with planet injected (green) and good recovery when no planet is injected (black); false positives when a planet is injected (dashed black line) and no planet is injected (red) from the same blind tests. The dotted lines correspond to what would be obtained if the variability was following a ![]() law (
law (![]() in the case of the detection rate), scaled to the values at 180 days.
in the case of the detection rate), scaled to the values at 180 days.
Current usage metrics show cumulative count of Article Views (full-text article views including HTML views, PDF and ePub downloads, according to the available data) and Abstracts Views on Vision4Press platform.
Data correspond to usage on the plateform after 2015. The current usage metrics is available 48-96 hours after online publication and is updated daily on week days.
Initial download of the metrics may take a while.