Fig. 19
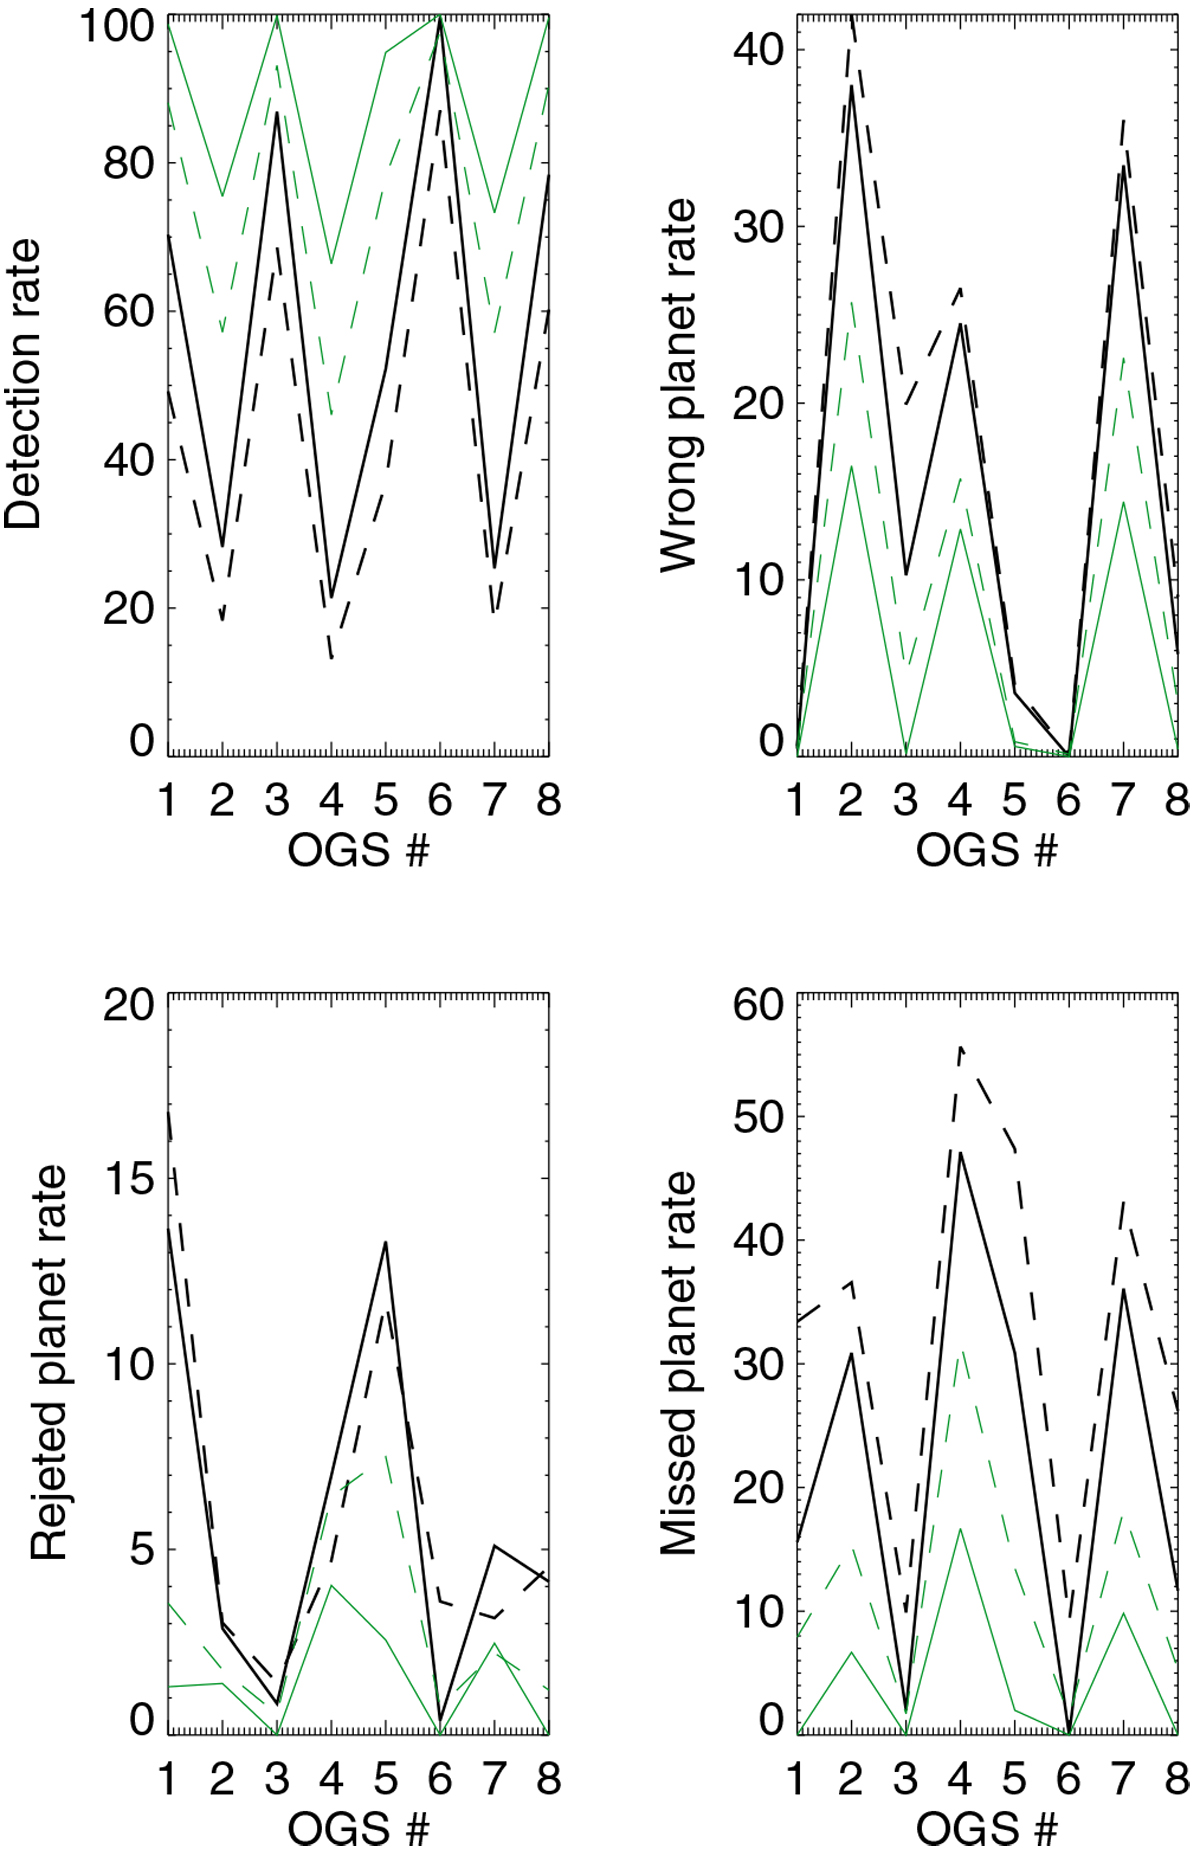
Comparison of average rates for 1 MEarth (black) and 2 MEarth (green), and without taking projection into account (solid lines, the mass is the apparent mass) and taking inclination into account (dashed lines, the mass is the true mass). The number associated to each OGS configuration corresponds to the order of the plots in Fig. 17 (from top to bottom, i.e. GRAhigh is number 1, SGmed is number 2 and so on). The detection rate plot corresponds to the green curves in the left panels in Fig. 17, the wrong planet rate plot to the brown curves, the rejected planet rate plot to the orange curves, and the missed planet rate plot to the blue curves in the right panels in Fig. 17.
Current usage metrics show cumulative count of Article Views (full-text article views including HTML views, PDF and ePub downloads, according to the available data) and Abstracts Views on Vision4Press platform.
Data correspond to usage on the plateform after 2015. The current usage metrics is available 48-96 hours after online publication and is updated daily on week days.
Initial download of the metrics may take a while.