Fig. 18
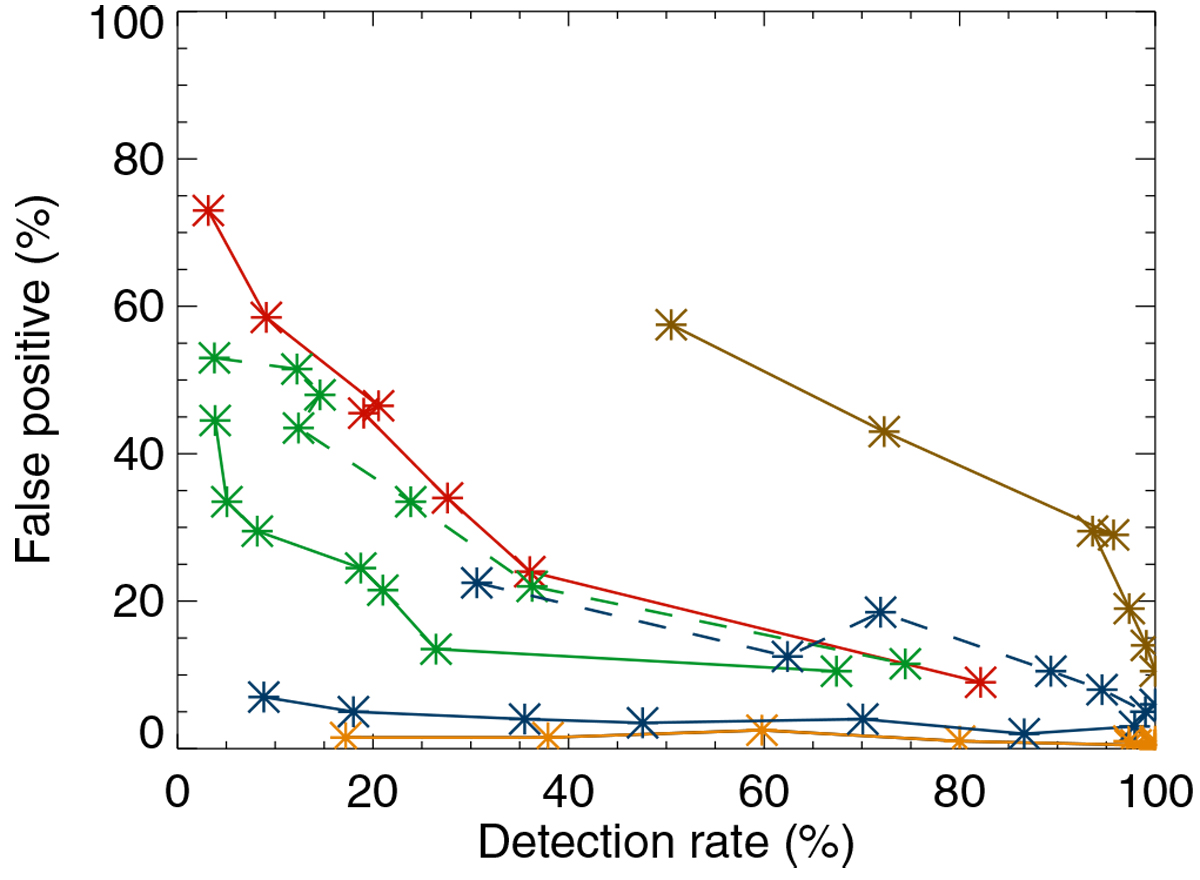
False positive rate vs. detection rate for each OGS configuration (GRAhigh in orange, SGmed in res, SGlow in brown, ALLGRAhigh,SGmed in green, andALLGRAhigh,SGlow in blue) in main blind tests. The dashed lines correspond to configurations including GRAlow. The orange dashed line is not visible (all points in the lower right corner).
Current usage metrics show cumulative count of Article Views (full-text article views including HTML views, PDF and ePub downloads, according to the available data) and Abstracts Views on Vision4Press platform.
Data correspond to usage on the plateform after 2015. The current usage metrics is available 48-96 hours after online publication and is updated daily on week days.
Initial download of the metrics may take a while.