Fig. 17
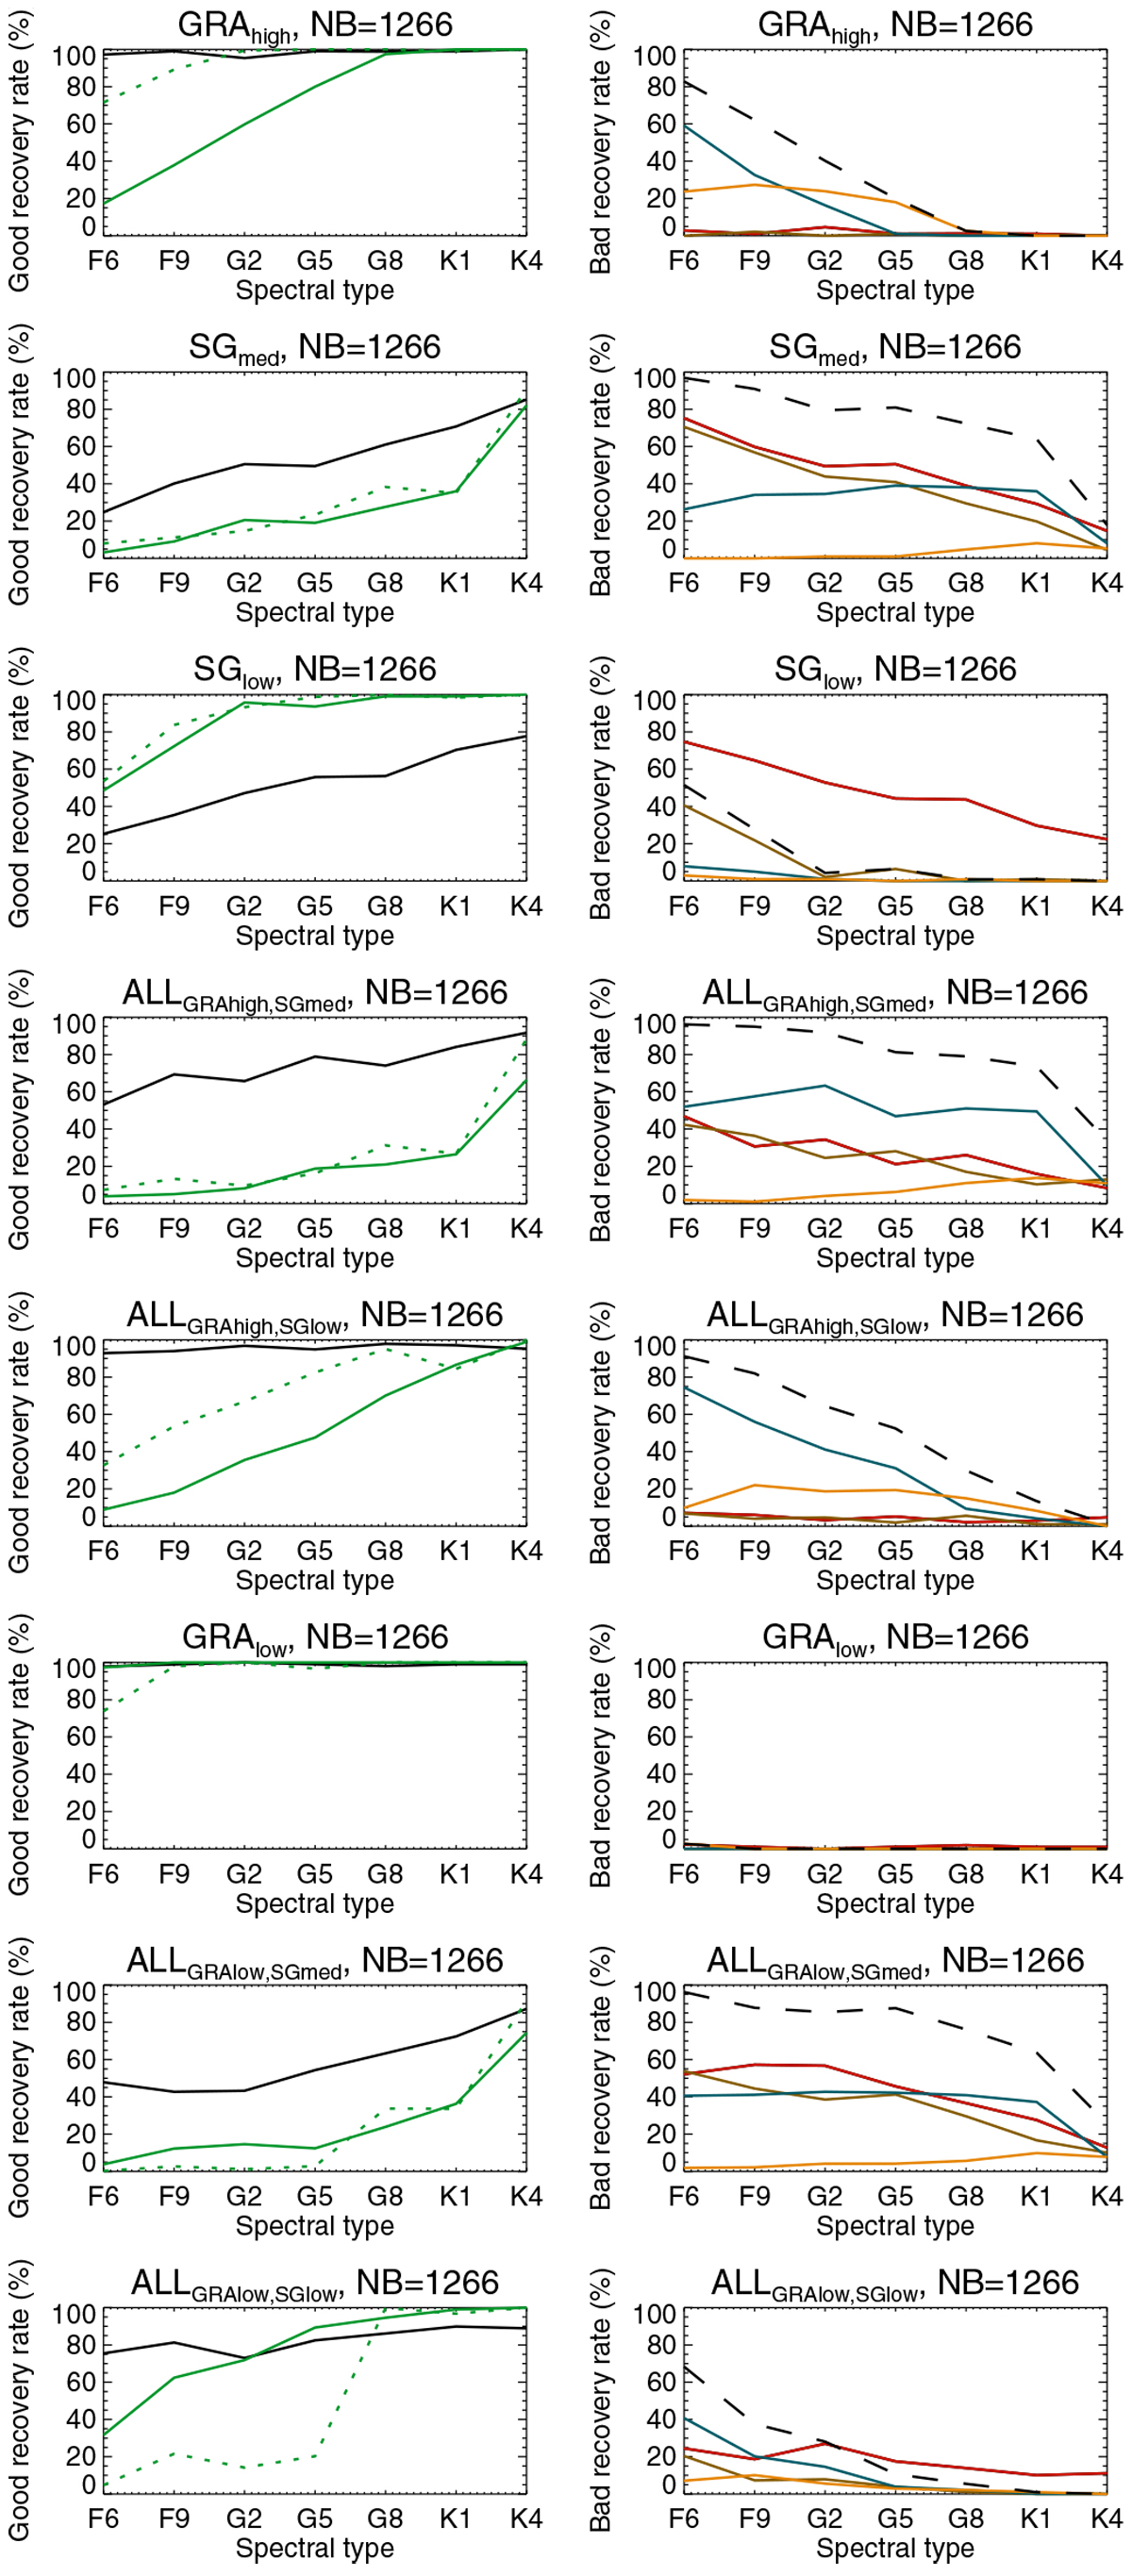
Good recovery percentages (left-hand side panels) and bad recovery percentages (right-hand side panels) vs. spectral type in the main blind test (1266 points, 1 MEarth). Good recoveries include no detection when no injected planet (black) and good planet recovered when injected (green). The green dotted line corresponds to the detection rate obtained in Sect. 3 with the theoretical false positive levels for the middle of the habitable zone for comparison. Bad recoveries include the false positive rate when no planet is injected (red), wrong planet detected (brown), rejection of true planet (orange), and missed planet (blue). The dashed black line is the sum of all bad recovery rates when a planet is injected (brown+orange+blue).
Current usage metrics show cumulative count of Article Views (full-text article views including HTML views, PDF and ePub downloads, according to the available data) and Abstracts Views on Vision4Press platform.
Data correspond to usage on the plateform after 2015. The current usage metrics is available 48-96 hours after online publication and is updated daily on week days.
Initial download of the metrics may take a while.