Fig. 16
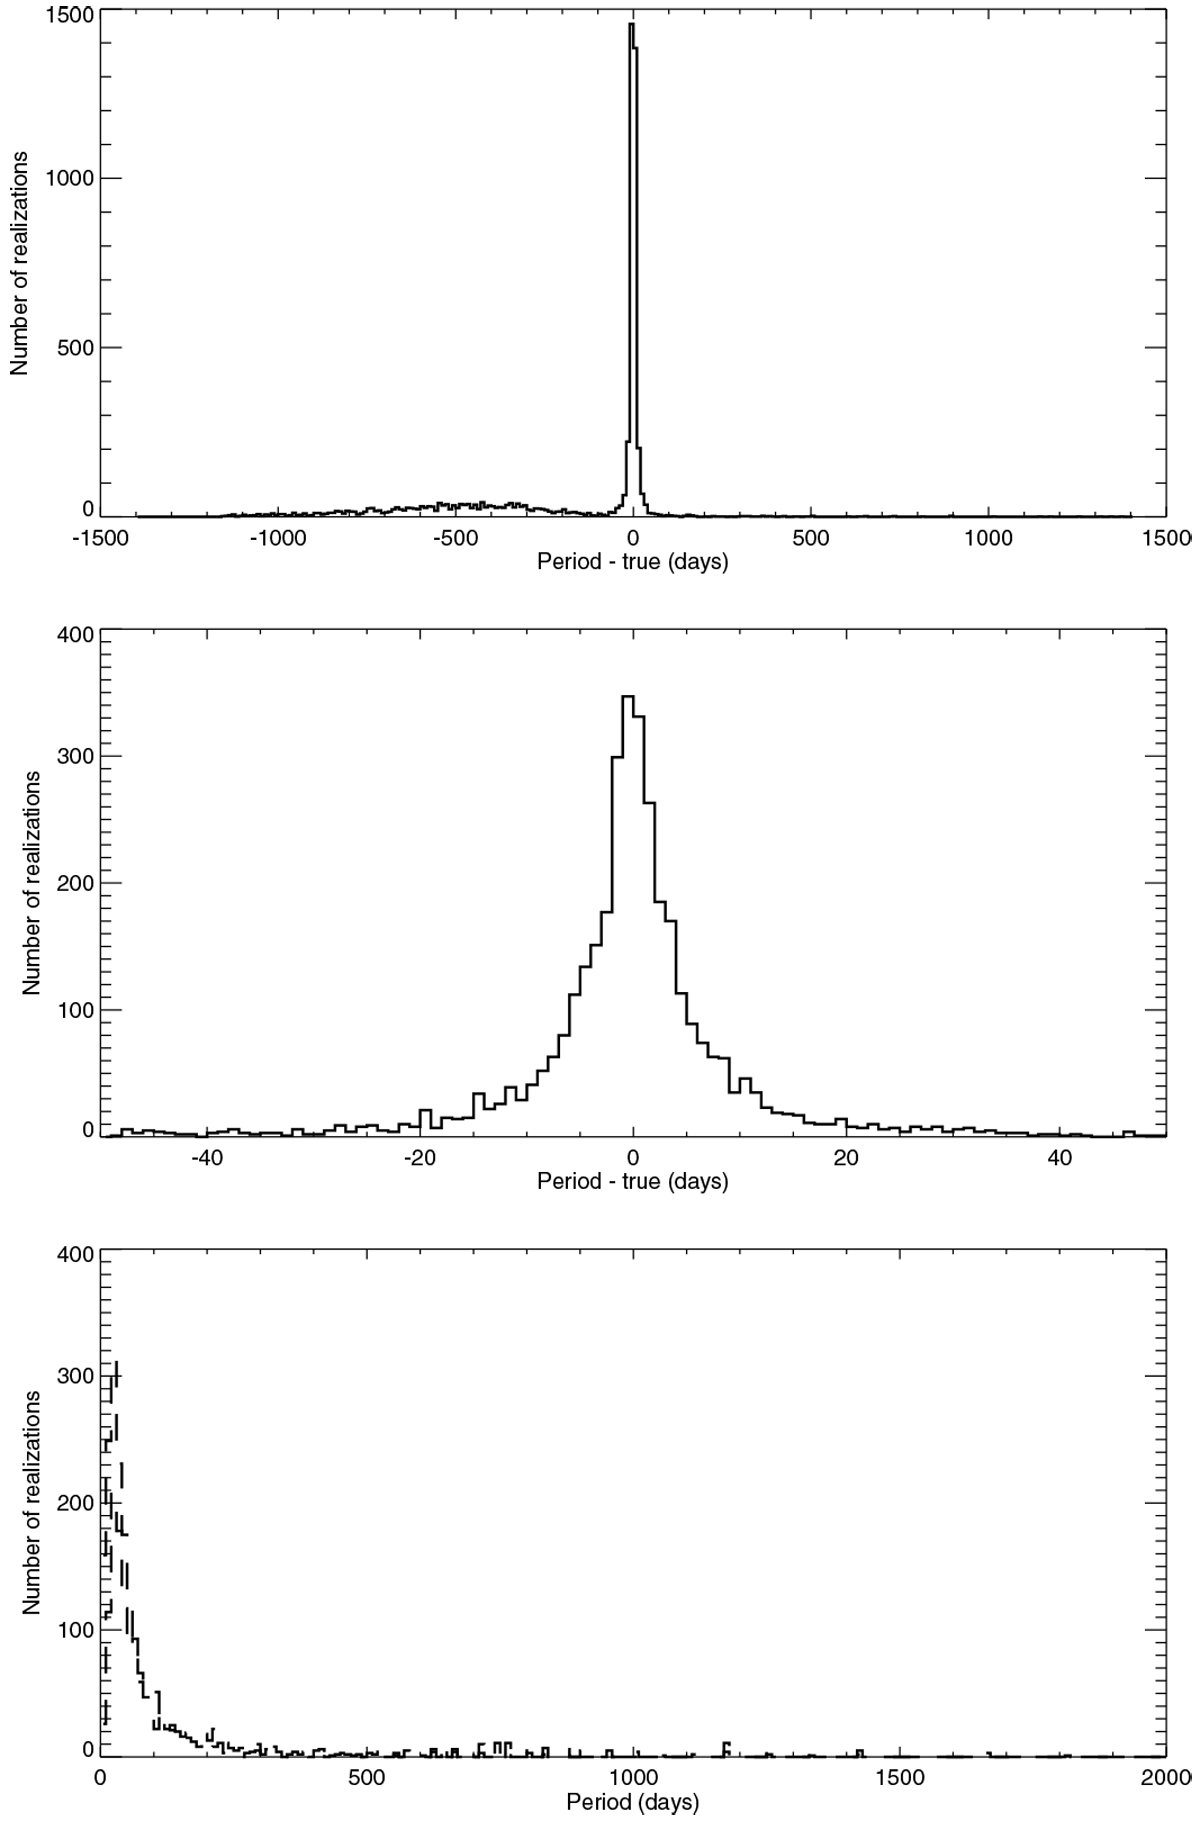
Distribution of the difference between the highest peak period and true period for all OGS configurations and all realisations with injected planet in the blind test (1266 points, 1 MEarth), corresponding to a total of 5546 realisations. The middle panel is a zoom in the [−50d,50d] range. The lower panel shows the distribution of the periods found outside the [−50d,50d] range when a planet is injected (solid line), and when no planet is injected (dashed line).
Current usage metrics show cumulative count of Article Views (full-text article views including HTML views, PDF and ePub downloads, according to the available data) and Abstracts Views on Vision4Press platform.
Data correspond to usage on the plateform after 2015. The current usage metrics is available 48-96 hours after online publication and is updated daily on week days.
Initial download of the metrics may take a while.