Fig. 10
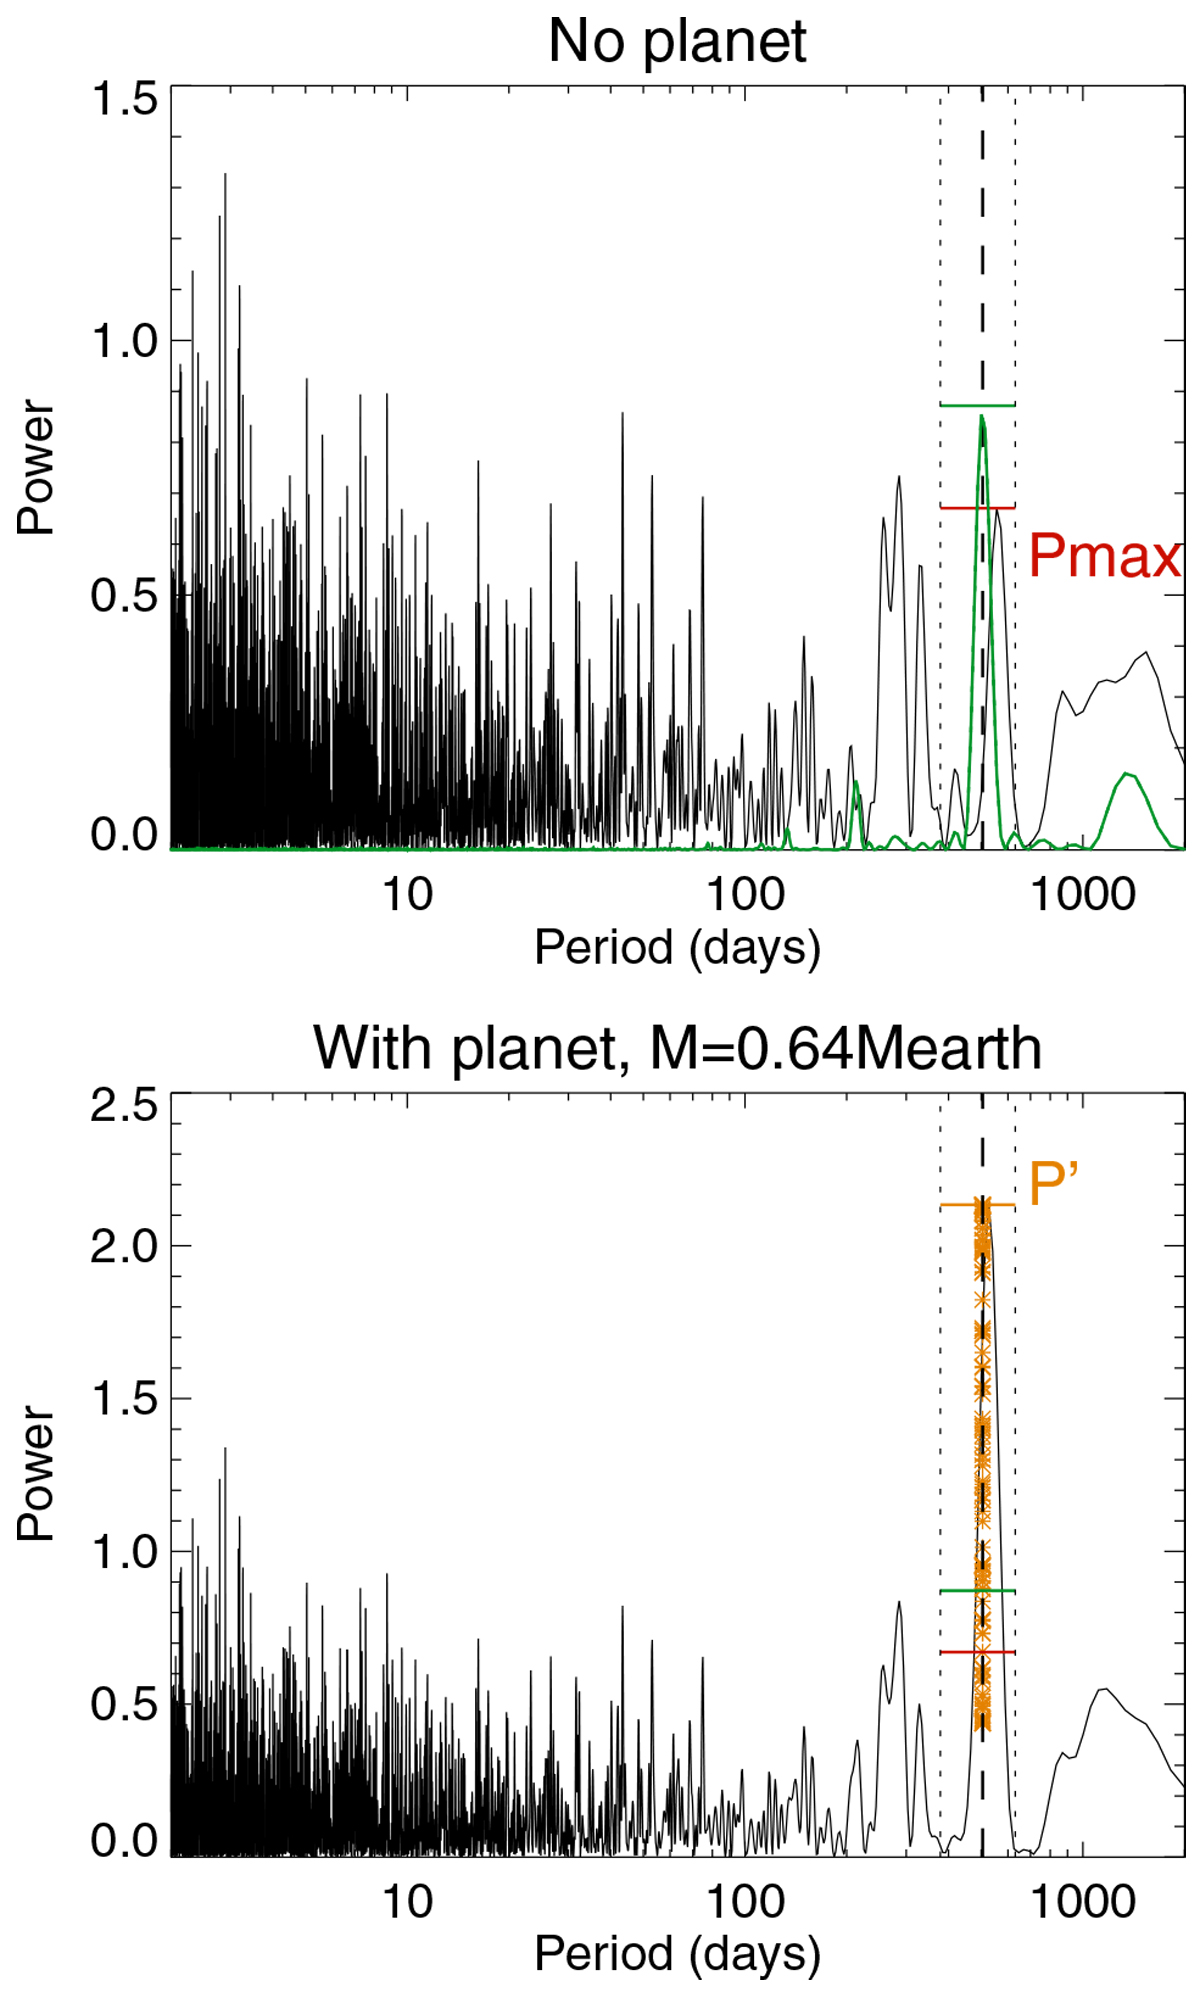
Example of the periodogram for OGS alone (upper panel, GRAhigh alone) and with a planet at LPA mass (0.53 MEarth, lower panel) to illustrate the LPA computations. The red and green horizontal lines correspond to the maximum of the OGS periodogram in the window delimited by the dotted lines and multiplied by 1.3 respectively. The green solid line periodogram in the upper panel is for the planet alone. The example of periodogram with OGS + planet is for an arbitrary phase of the planet, and the horizontal orange line corresponds to the maximum power. Orange stars are for 100 realisations of the planet phase.
Current usage metrics show cumulative count of Article Views (full-text article views including HTML views, PDF and ePub downloads, according to the available data) and Abstracts Views on Vision4Press platform.
Data correspond to usage on the plateform after 2015. The current usage metrics is available 48-96 hours after online publication and is updated daily on week days.
Initial download of the metrics may take a while.