Fig. 9.
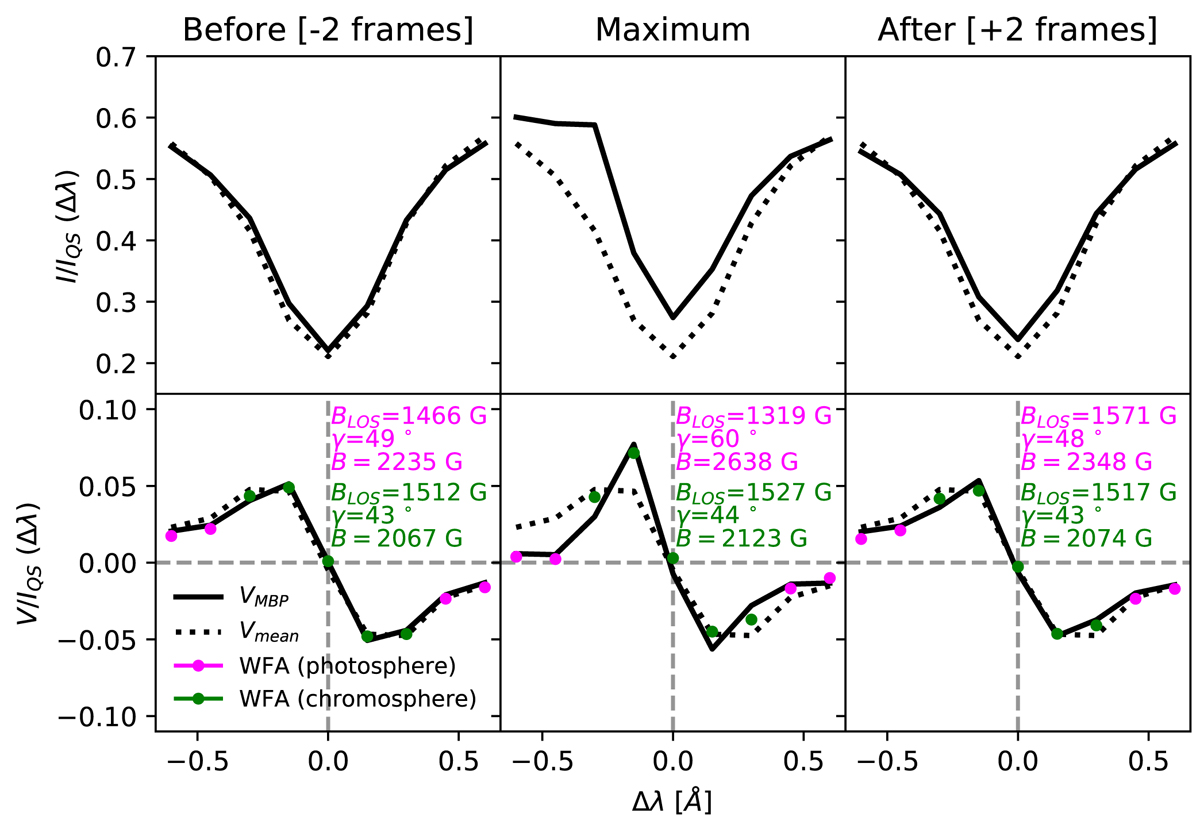
Observed Stokes I and V profiles (solid lines) and temporally averaged profiles (dotted lines) at the MBP in PMJ 1 during three different temporal stages. The labels on each panel indicate the BLOS, γ and B values inferred from Eqs. (5) and (6), evaluated in the line wings (magenta) and the line core (green). The profiles resulting from the WFA fits are shown with magenta and green markers for the wings and the line core, respectively.
Current usage metrics show cumulative count of Article Views (full-text article views including HTML views, PDF and ePub downloads, according to the available data) and Abstracts Views on Vision4Press platform.
Data correspond to usage on the plateform after 2015. The current usage metrics is available 48-96 hours after online publication and is updated daily on week days.
Initial download of the metrics may take a while.