Fig. 8.
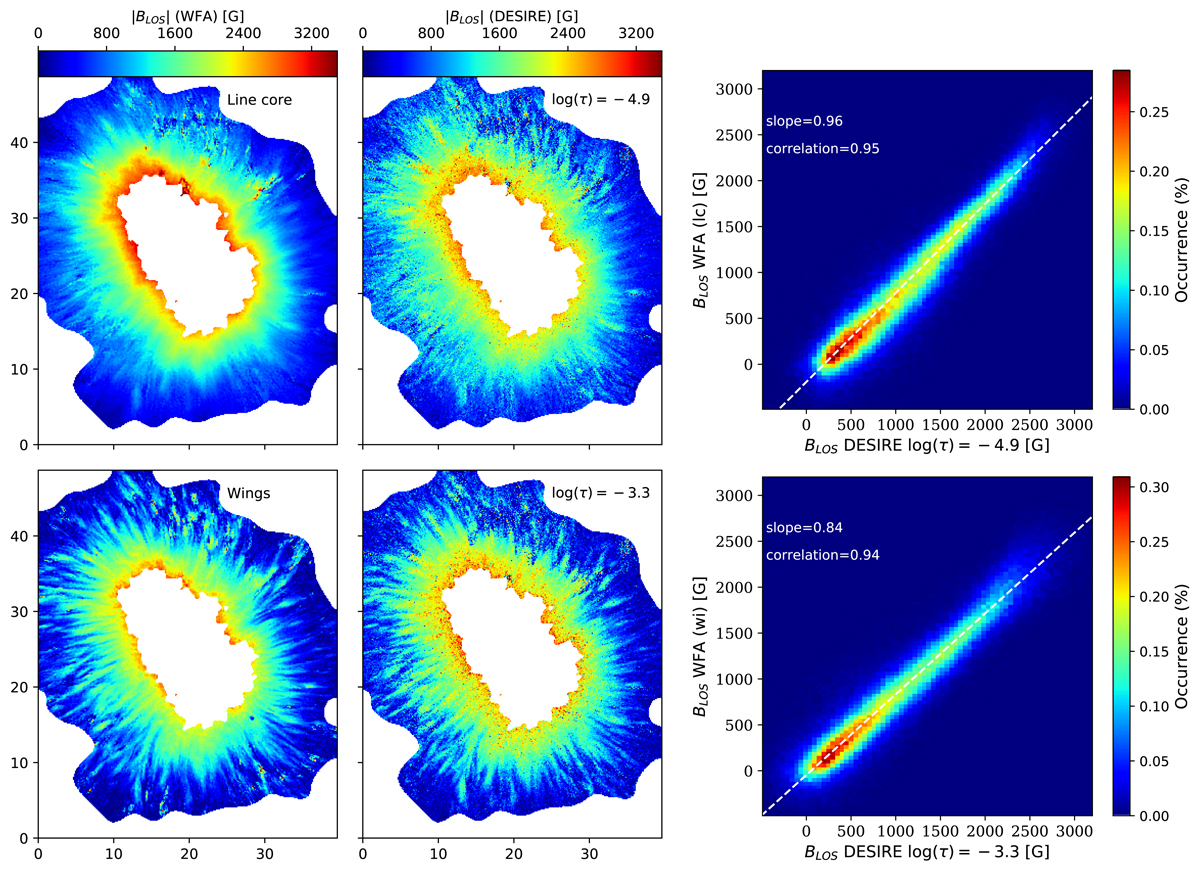
Comparison between the BLOS values obtained in the sunspot penumbra (same time step as in Fig. 7) using the WFA and DeSIRe inversions. Left column: results from the WFA applied to the line core (top) and to the wings (bottom). Central column: inversion result at log(τ) = − 4.9 (top) and log(τ) = − 3.3 (bottom). Right column: density plots comparing the values from the two methods. We consider only penumbral pixels where χ2 < 3 is obtained with both methods. White dashed lines are regression lines.
Current usage metrics show cumulative count of Article Views (full-text article views including HTML views, PDF and ePub downloads, according to the available data) and Abstracts Views on Vision4Press platform.
Data correspond to usage on the plateform after 2015. The current usage metrics is available 48-96 hours after online publication and is updated daily on week days.
Initial download of the metrics may take a while.