Fig. 7.
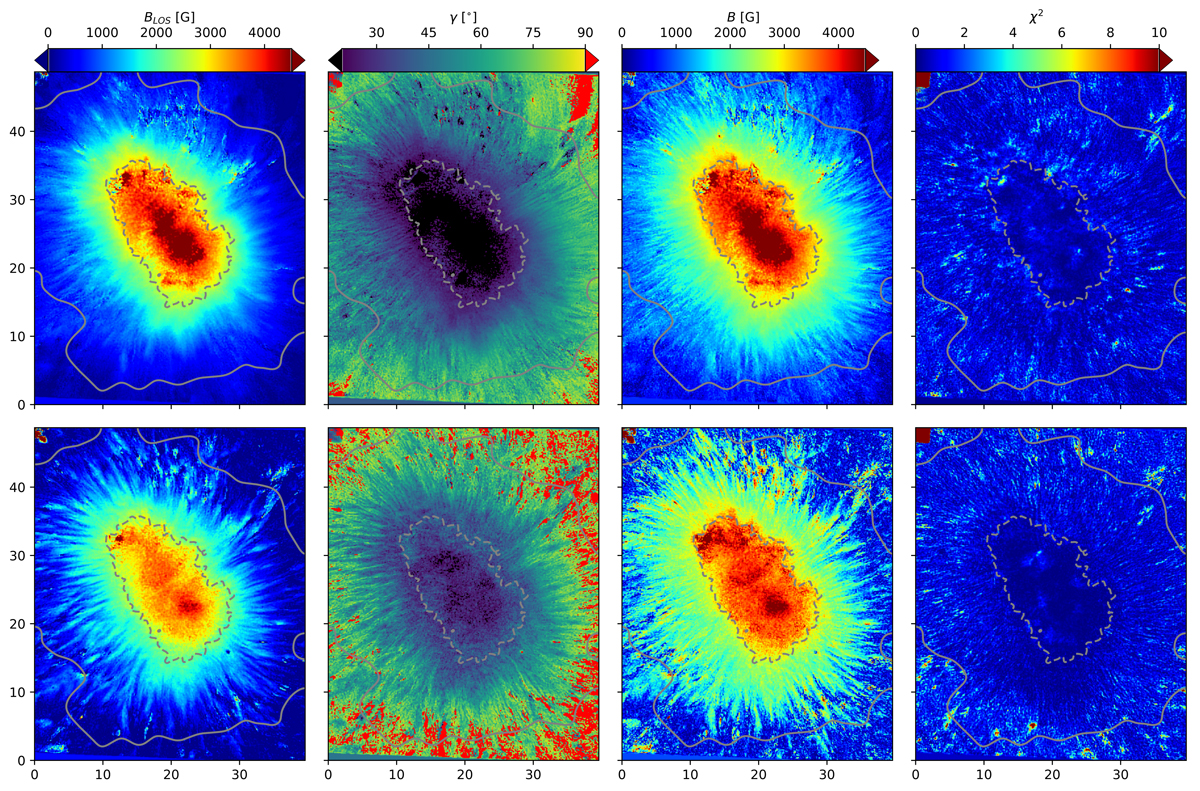
From left to right: maps of the longitudinal component of the magnetic field BLOS, the field inclination γ with respect to the LOS, the magnetic field strength B, and the merit function χ2 that result from the WFA applied to the line core wavelengths (top panels) and to the line wing wavelengths (bottom panels) for the entire sunspot as recorded at 08:13:22 UT. Red patches on the inclination maps are pixels where γ > 90°. Smoothed gray contours delimit the inner (dashed) and outer (solid) penumbral boundaries.
Current usage metrics show cumulative count of Article Views (full-text article views including HTML views, PDF and ePub downloads, according to the available data) and Abstracts Views on Vision4Press platform.
Data correspond to usage on the plateform after 2015. The current usage metrics is available 48-96 hours after online publication and is updated daily on week days.
Initial download of the metrics may take a while.