Fig. 4.
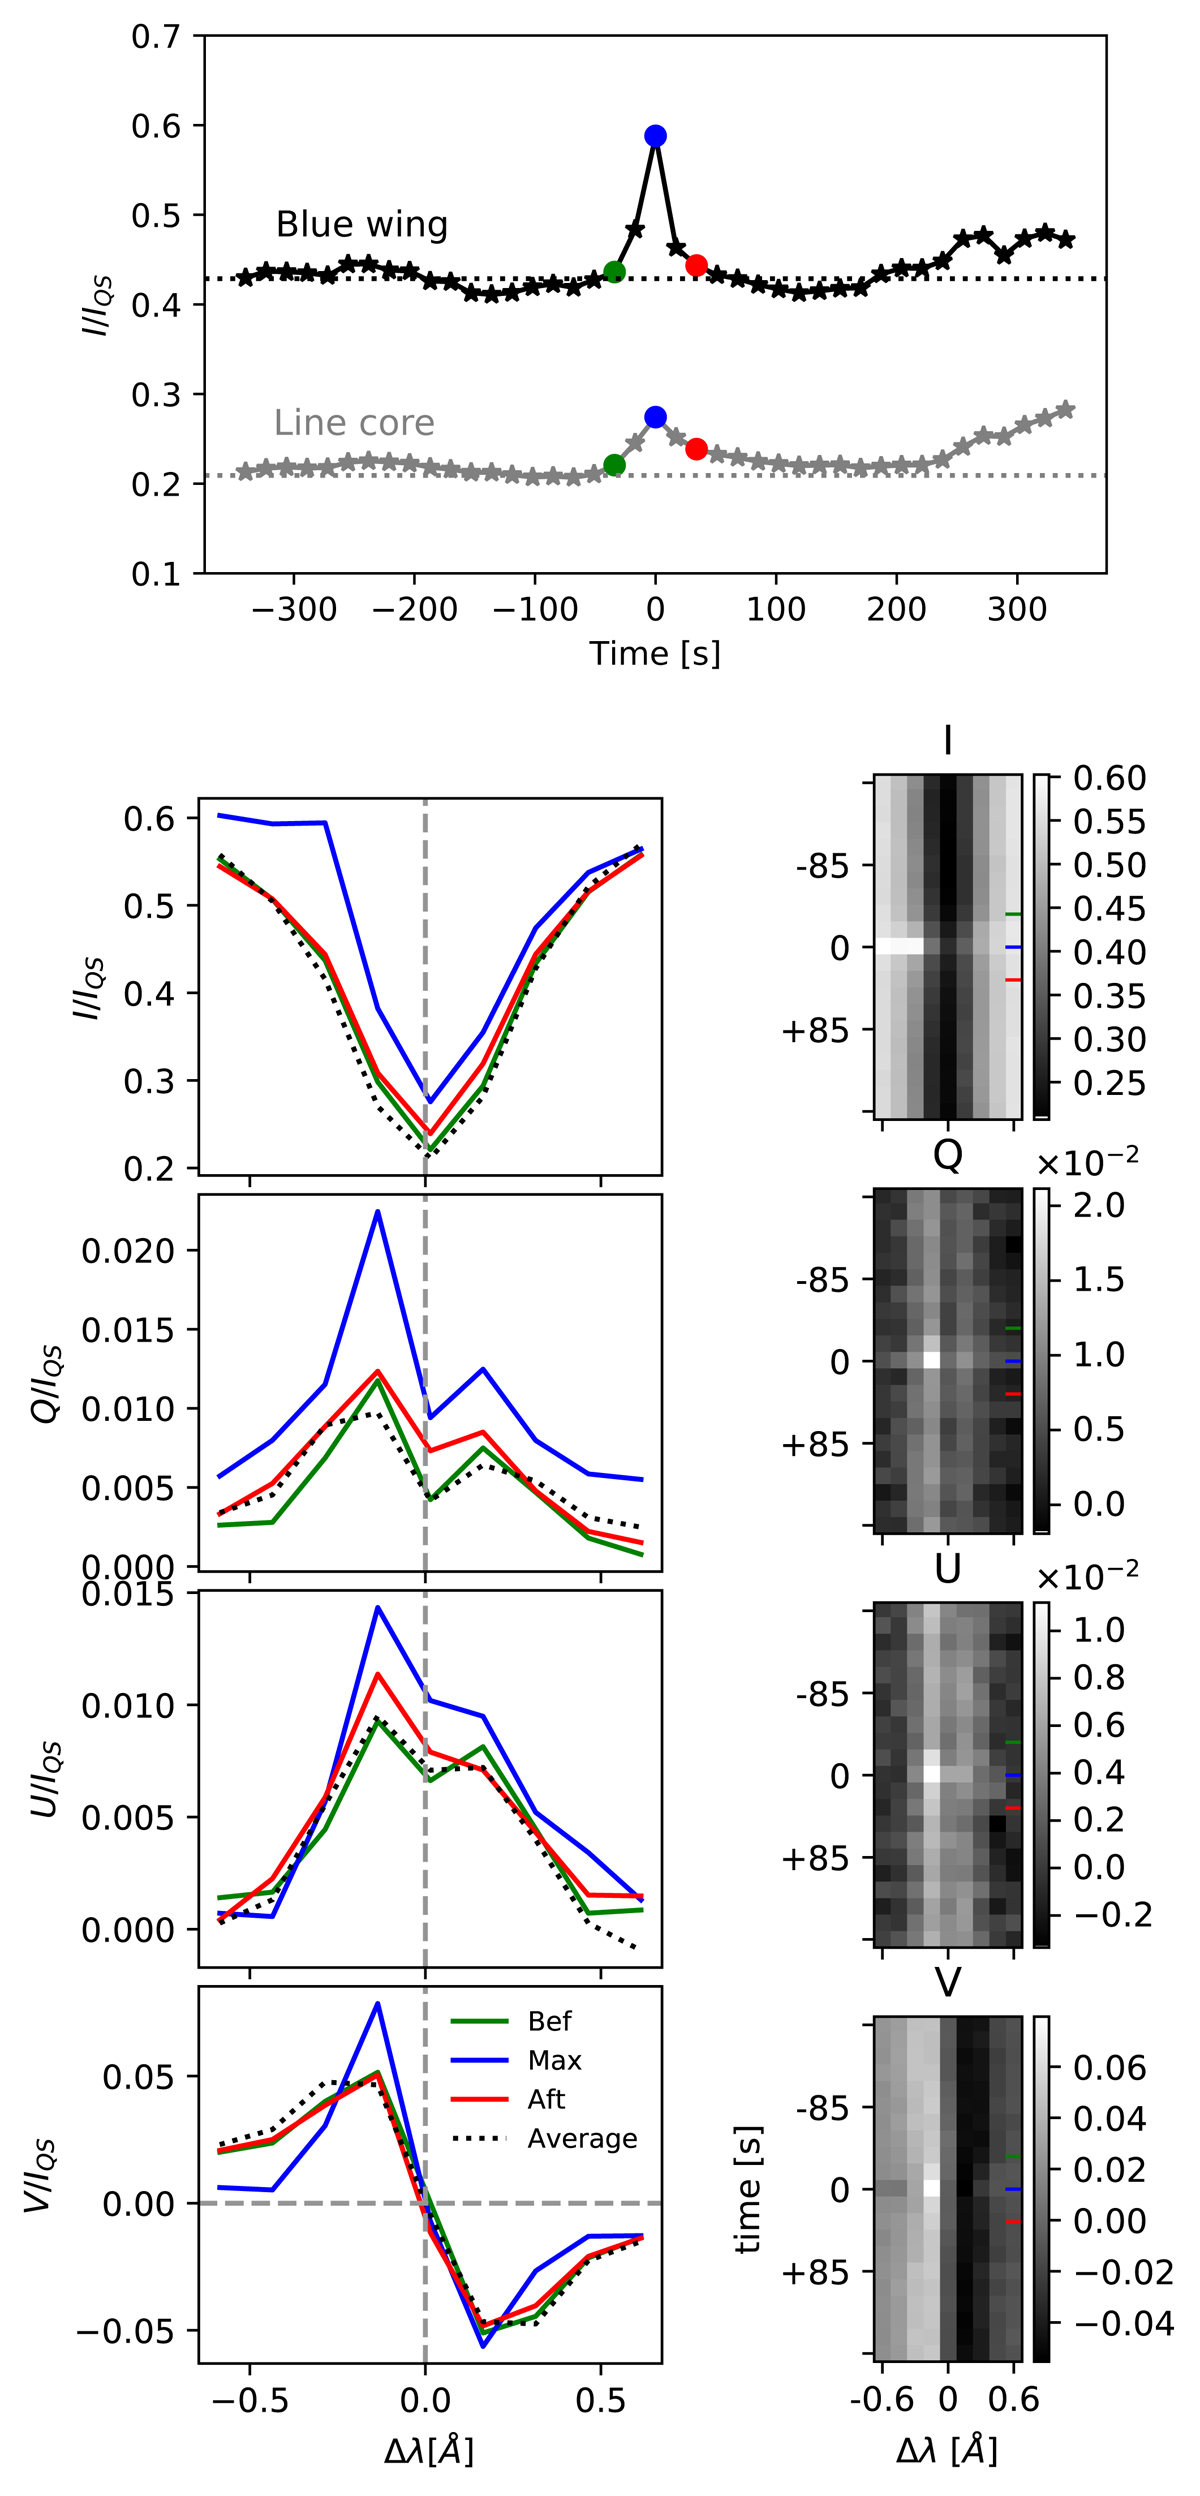
Polarization signals of PMJ 1. Top: temporal evolution of the blue-wing intensity (black) and line-core intensity (gray) at the MBP, averaged over its eight closest neighboring pixels. The green dots correspond to the time step before the PMJ becomes visible (first row in Fig. 3), the blue dots to the maximum brightness stage (third row in Fig. 3), and the red dots to the frame after the PMJ disappears (last row in Fig. 3). The black and gray dotted lines indicate the blue-wing and line-core intensities, respectively, averaged over the full time sequence. Bottom left: Stokes profiles emerging from the MBP before (green), during (blue), and after (red) the PMJ is visible. The black dotted profiles correspond to the average Stokes profiles over the complete time series at the MBP. Bottom right: temporal evolution of the Stokes profiles at the MBP. The colored dashes on the right indicate the three time steps of interest, with the same color code.
Current usage metrics show cumulative count of Article Views (full-text article views including HTML views, PDF and ePub downloads, according to the available data) and Abstracts Views on Vision4Press platform.
Data correspond to usage on the plateform after 2015. The current usage metrics is available 48-96 hours after online publication and is updated daily on week days.
Initial download of the metrics may take a while.