Fig. 20.
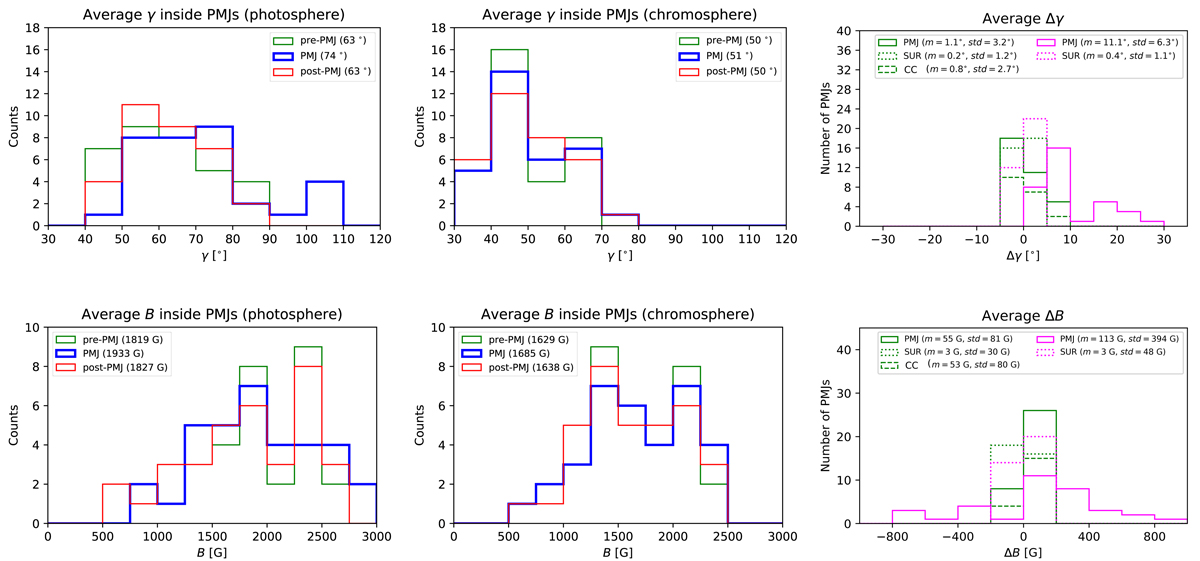
Magnetic field configuration of 34 PMJs in the upper photosphere (left) and low chromosphere (center). The histograms show the average values of γ (top), and B (bottom) inside the PMJ regions during three different stages: the pre-PMJ phase (green), which corresponds to the average field during 2 min before the PMJ, the maximum brightness (blue), and the post-PMJ phase (red), which is the average field during 2 min after the PMJ. The legends give the mean values of each distribution. Right: distribution of magnetic field changes between the pre-PMJ phase and the maximum brightness in the photosphere (magenta) and in the chromosphere (green) inside the PMJ regions (solid) and in the surroundings (dotted). The green dashed distributions show the chromospheric field changes occurring inside the CC regions for the 19 PMJs marked with circles in Fig. 2. The legends give the mean m and the standard deviation std of each distribution.
Current usage metrics show cumulative count of Article Views (full-text article views including HTML views, PDF and ePub downloads, according to the available data) and Abstracts Views on Vision4Press platform.
Data correspond to usage on the plateform after 2015. The current usage metrics is available 48-96 hours after online publication and is updated daily on week days.
Initial download of the metrics may take a while.