Fig. 1.
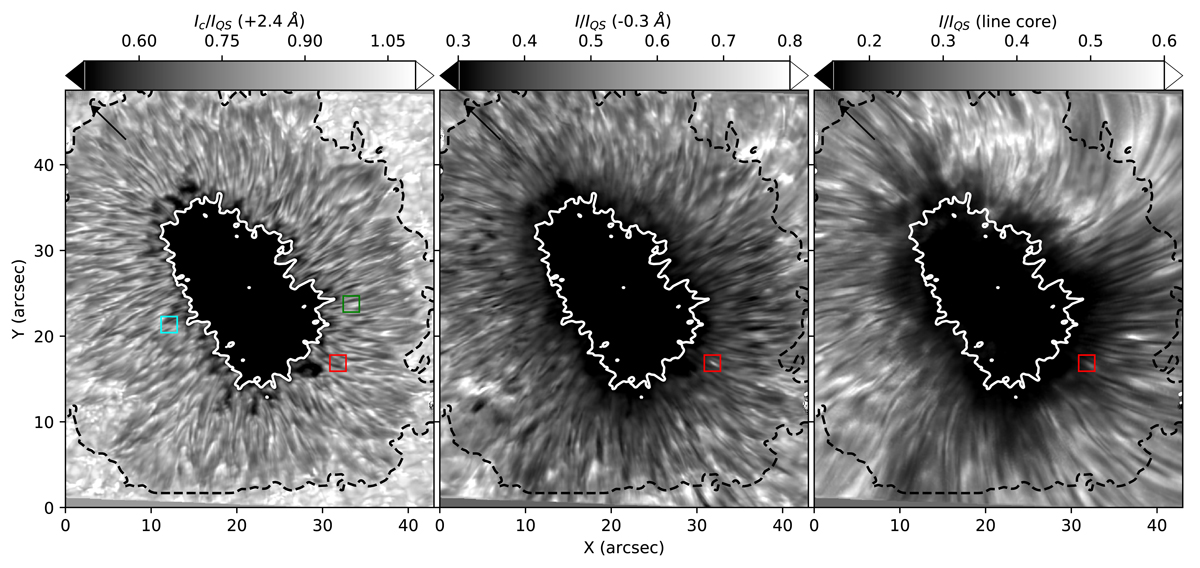
Main sunspot in active region 12 553 on 2016 June 16 recorded with the CRISP instrument at different wavelengths within the Ca II 8542 Å line. Left panel: continuum intensity Ic image, at +2.4 Å from the line core. Central panel: blue-wing image, at −0.3 Å from the line core. Right panel: line core image. All the images are normalized to the mean continuum value in the quiet sun, IQS. The umbra-penumbra boundary (white contours) is at Ic/IQS = 0.45 and the outer penumbral boundary (black dashed contours) is at Ic/IQS = 0.98. Black arrows point toward the disk center. Small colored squares on the continuum image highlight the location of three PMJs referred to as PMJ 1 (red), PMJ 2 (green), and PMJ 3 (cyan) in the main text. The images correspond to the frame in which PMJ 1 displays the maximum blue-wing brightness.
Current usage metrics show cumulative count of Article Views (full-text article views including HTML views, PDF and ePub downloads, according to the available data) and Abstracts Views on Vision4Press platform.
Data correspond to usage on the plateform after 2015. The current usage metrics is available 48-96 hours after online publication and is updated daily on week days.
Initial download of the metrics may take a while.