Fig. 6.
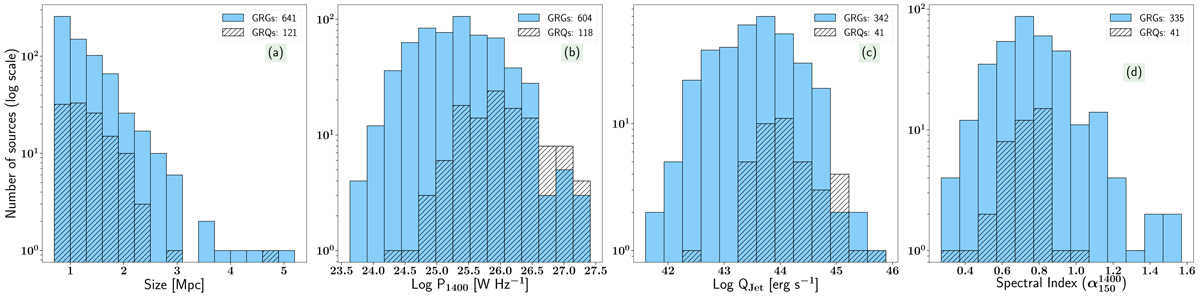
Distributions of the unmatched sample of GRGs and GRQs with their different properties, represented in not-hatched and hatched bins, respectively, in the redshift range of 0.01 < z < 1.0. The mean and median values of the distributions are given in Table 3. Panel a: size distribution. Panel b: distribution of the radio power at 1400 MHz (P1400). Panel c: distribution of the jet kinetic power (QJet). Panel d: spectral index (![]() ) distribution.
) distribution.
Current usage metrics show cumulative count of Article Views (full-text article views including HTML views, PDF and ePub downloads, according to the available data) and Abstracts Views on Vision4Press platform.
Data correspond to usage on the plateform after 2015. The current usage metrics is available 48-96 hours after online publication and is updated daily on week days.
Initial download of the metrics may take a while.