Free Access
Fig. 2.
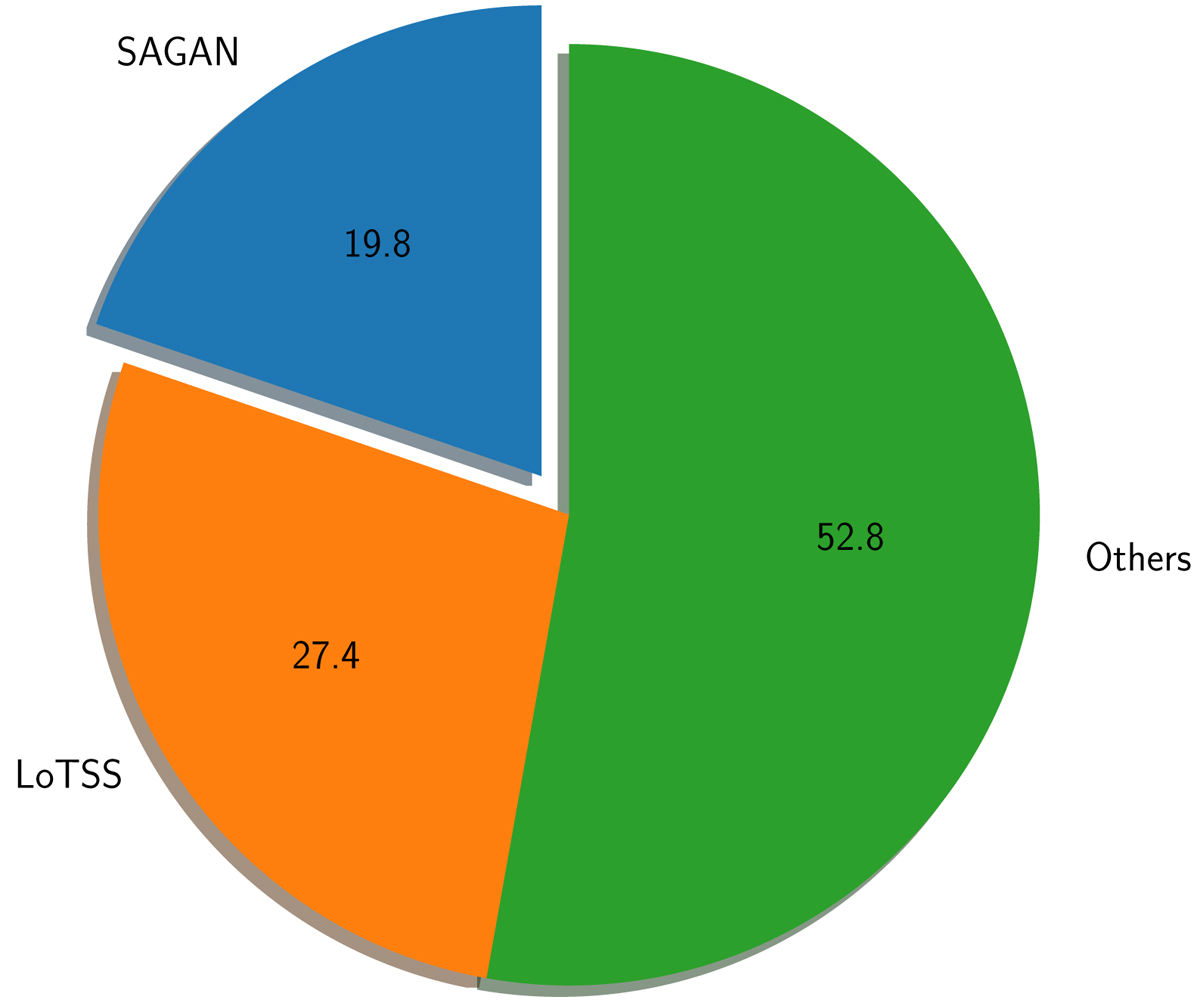
Pie diagram representing the contribution of SGS (blue: ∼20%) and LoTSS-GRGs (orange: ∼27%) to the total GRG population. The GRGs reported in the literature until March 2020 are plotted in green. We show all the known (820) sources without any filters.
Current usage metrics show cumulative count of Article Views (full-text article views including HTML views, PDF and ePub downloads, according to the available data) and Abstracts Views on Vision4Press platform.
Data correspond to usage on the plateform after 2015. The current usage metrics is available 48-96 hours after online publication and is updated daily on week days.
Initial download of the metrics may take a while.