Fig. 1.
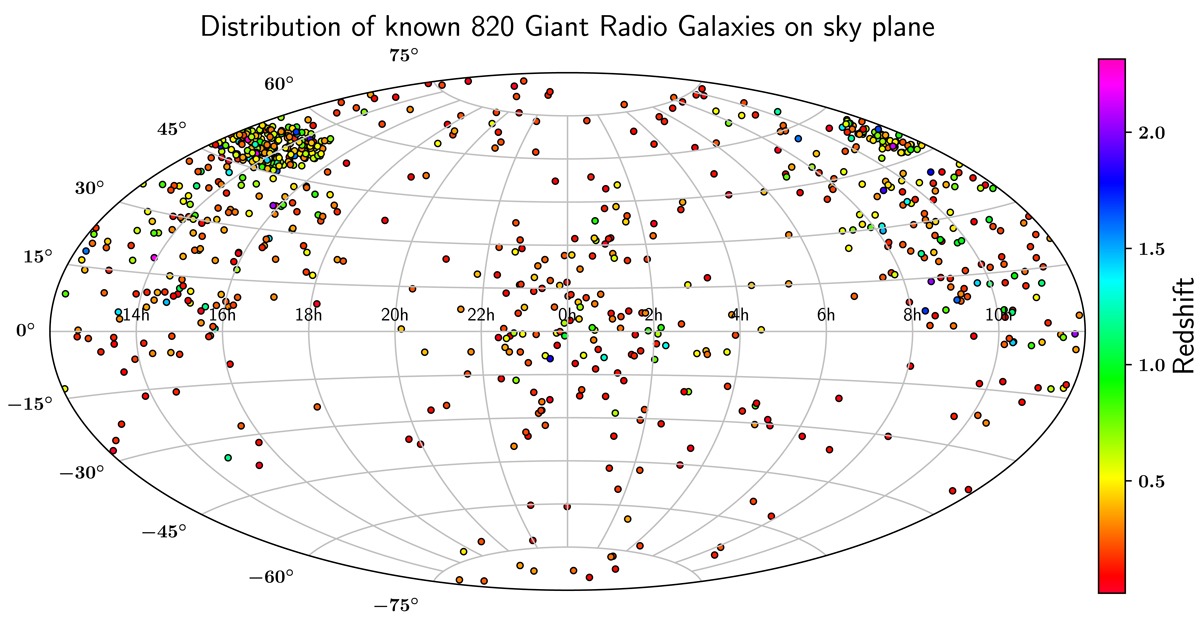
Sky distribution of all the known GRGs from 1974 to 2020 together with our SAGAN GRG sample in an Aitoff projection. The total number of GRGs plotted here is 820 (LoTSS: 225 and SAGAN: 162, and all others from literature: 433). The large clustering of GRGs in the northern region of the plot (right ascension 10h45m to 15h30m and declination 45° 00′ to 57° 00′) is the result of finding the large sample of GRGs (225) in the LoTSS by us (Dabhade et al. 2020). The colour of the points on the plot corresponds to their redshift, which is indicated in the vertical colour bar at the right side of the plot. We do not use all the 820 GRGs for our analysis in this paper, but only those (762 GRGs) with a redshift lower than 1.
Current usage metrics show cumulative count of Article Views (full-text article views including HTML views, PDF and ePub downloads, according to the available data) and Abstracts Views on Vision4Press platform.
Data correspond to usage on the plateform after 2015. The current usage metrics is available 48-96 hours after online publication and is updated daily on week days.
Initial download of the metrics may take a while.